

Electronic component manufacturer Belden (NYSE: BDC) reported Q3 CY2025 results exceeding the market’s revenue expectations, with sales up 6.6% year on year to $698.2 million. The company expects next quarter’s revenue to be around $695 million, close to analysts’ estimates. Its non-GAAP profit of $1.97 per share was 2.6% above analysts’ consensus estimates.
Is now the time to buy Belden? Find out by accessing our full research report, it’s free for active Edge members.
Belden (BDC) Q3 CY2025 Highlights:
- Revenue: $698.2 million vs analyst estimates of $678.5 million (6.6% year-on-year growth, 2.9% beat)
- Adjusted EPS: $1.97 vs analyst estimates of $1.92 (2.6% beat)
- Adjusted EBITDA: $118.6 million vs analyst estimates of $117 million (17% margin, 1.4% beat)
- Revenue Guidance for Q4 CY2025 is $695 million at the midpoint, roughly in line with what analysts were expecting
- Adjusted EPS guidance for Q4 CY2025 is $1.95 at the midpoint, above analyst estimates of $1.93
- Operating Margin: 10.9%, in line with the same quarter last year
- Free Cash Flow Margin: 9.4%, similar to the same quarter last year
- Market Capitalization: $4.73 billion
"We are pleased to announce record Revenues and Adjusted EPS for the third quarter, a testament to our strategic focus and steady execution," said Ashish Chand, President and CEO of Belden Inc.
Company Overview
With its enamel-coated copper wire used in WWI for the Allied forces, Belden (NYSE: BDC) designs, manufactures, and sells electronic components to various industries.
Revenue Growth
Examining a company’s long-term performance can provide clues about its quality. Even a bad business can shine for one or two quarters, but a top-tier one grows for years. Over the last five years, Belden grew its sales at a mediocre 6.8% compounded annual growth rate. This was below our standard for the industrials sector and is a poor baseline for our analysis.
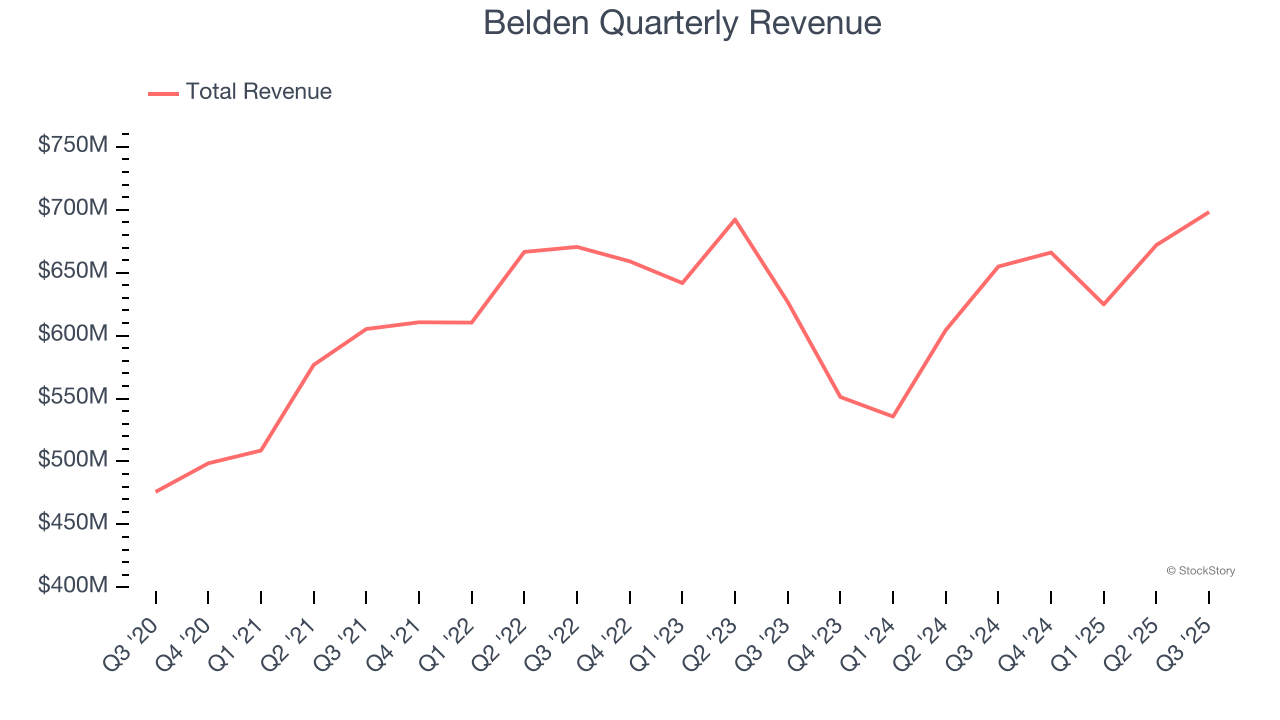
Long-term growth is the most important, but within industrials, a half-decade historical view may miss new industry trends or demand cycles. Belden’s recent performance shows its demand has slowed as its revenue was flat over the last two years. We also note many other Electronic Components businesses have faced declining sales because of cyclical headwinds. While Belden’s growth wasn’t the best, it did do better than its peers. 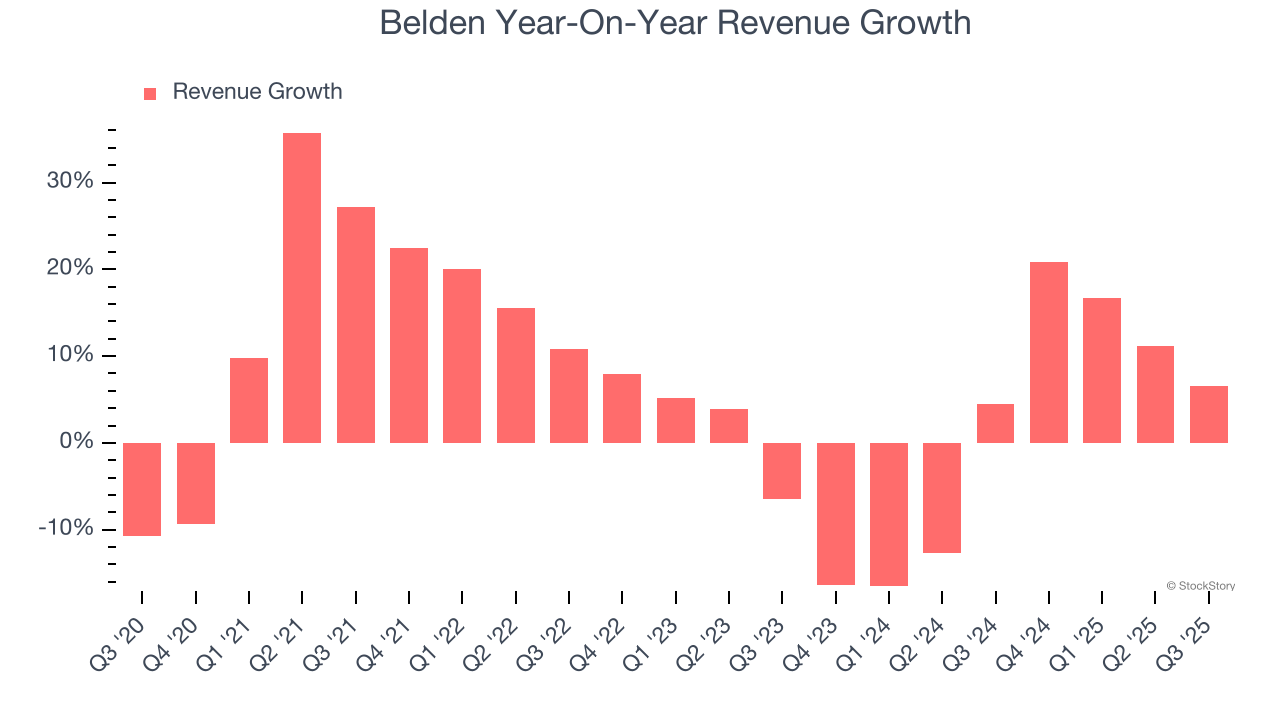
We can better understand the company’s revenue dynamics by analyzing its most important segments, Enterprise and Industrial, which are 45.4% and 54.6% of revenue. Over the last two years, Belden’s Enterprise revenue (network infrastructure and broadband solutions) averaged 1.5% year-on-year declines. On the other hand, its Industrial revenue (infrastructure digitization and automation) averaged 5.5% growth. 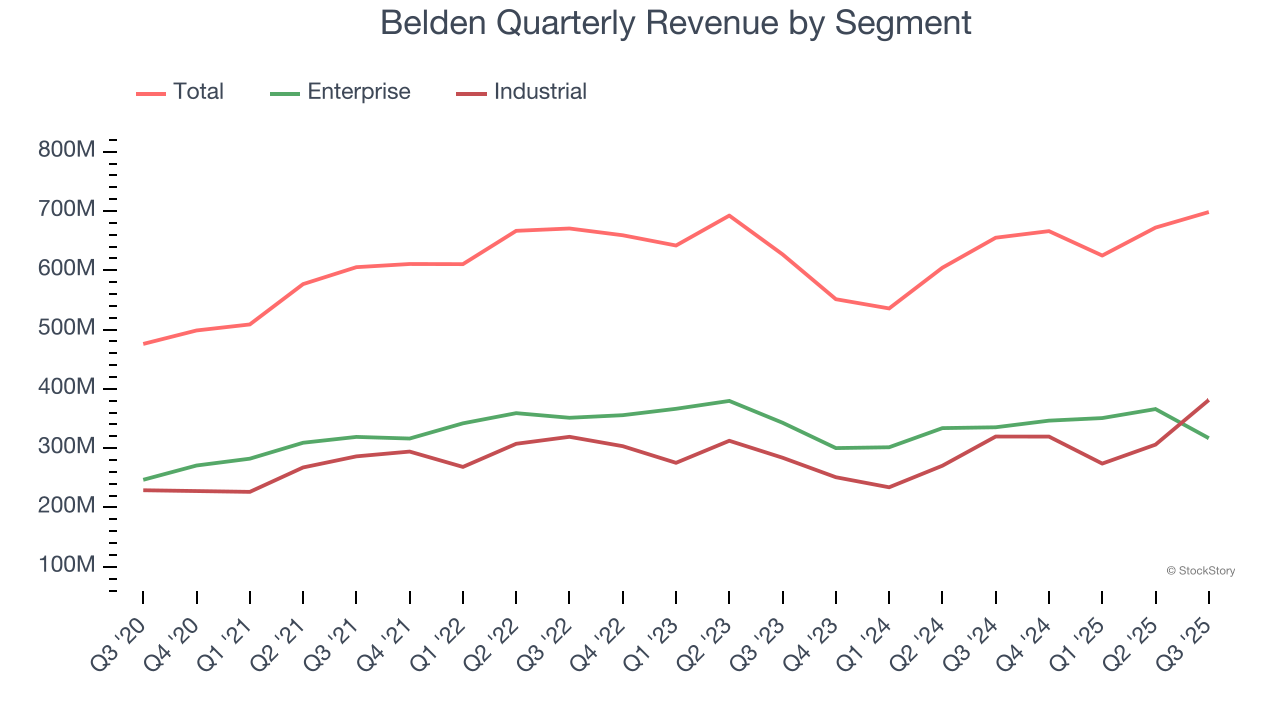
This quarter, Belden reported year-on-year revenue growth of 6.6%, and its $698.2 million of revenue exceeded Wall Street’s estimates by 2.9%. Company management is currently guiding for a 4.3% year-on-year increase in sales next quarter.
Looking further ahead, sell-side analysts expect revenue to grow 4.6% over the next 12 months. While this projection suggests its newer products and services will spur better top-line performance, it is still below the sector average.
Today’s young investors won’t have read the timeless lessons in Gorilla Game: Picking Winners In High Technology because it was written more than 20 years ago when Microsoft and Apple were first establishing their supremacy. But if we apply the same principles, then enterprise software stocks leveraging their own generative AI capabilities may well be the Gorillas of the future. So, in that spirit, we are excited to present our Special Free Report on a profitable, fast-growing enterprise software stock that is already riding the automation wave and looking to catch the generative AI next.
Operating Margin
Operating margin is one of the best measures of profitability because it tells us how much money a company takes home after procuring and manufacturing its products, marketing and selling those products, and most importantly, keeping them relevant through research and development.
Belden’s operating margin might fluctuated slightly over the last 12 months but has remained more or less the same, averaging 12% over the last five years. This profitability was top-notch for an industrials business, showing it’s an well-run company with an efficient cost structure. This result isn’t surprising as its high gross margin gives it a favorable starting point.
Looking at the trend in its profitability, Belden’s operating margin might fluctuated slightly but has generally stayed the same over the last five years. This raises questions about the company’s expense base because its revenue growth should have given it leverage on its fixed costs, resulting in better economies of scale and profitability.
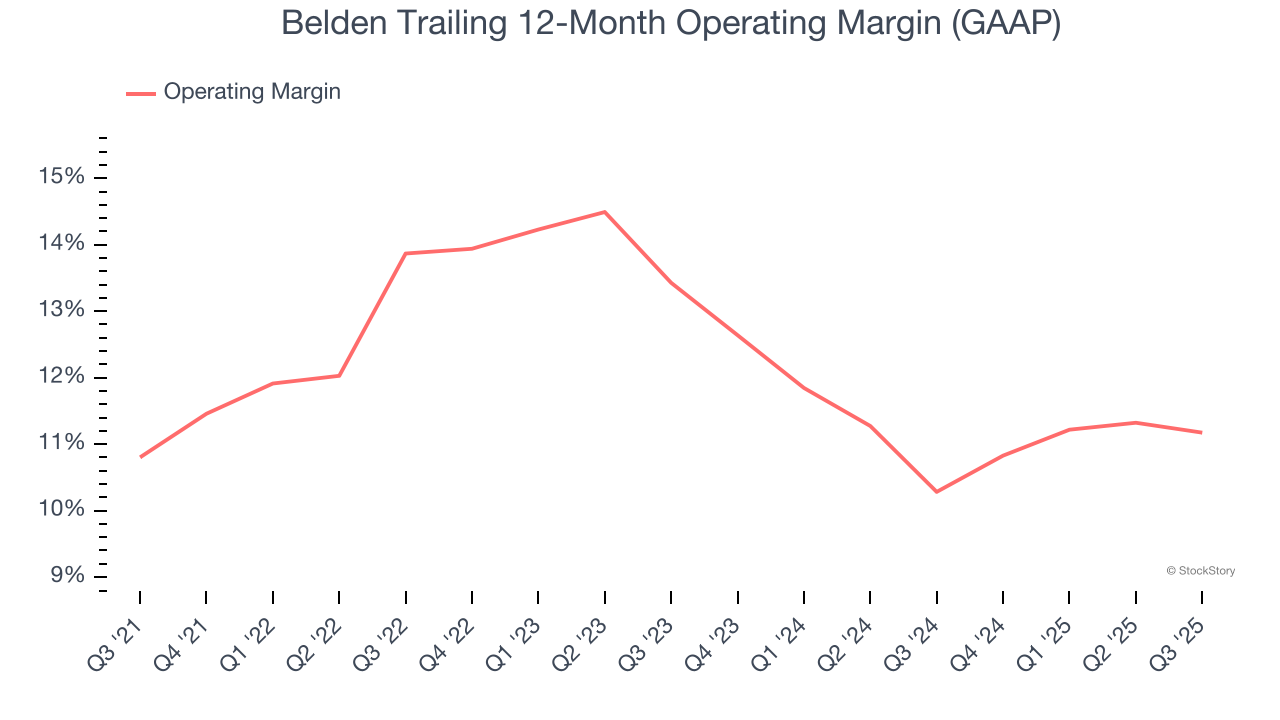
In Q3, Belden generated an operating margin profit margin of 10.9%, in line with the same quarter last year. This indicates the company’s cost structure has recently been stable.
Earnings Per Share
We track the long-term change in earnings per share (EPS) for the same reason as long-term revenue growth. Compared to revenue, however, EPS highlights whether a company’s growth is profitable.
Belden’s EPS grew at an astounding 19.3% compounded annual growth rate over the last five years, higher than its 6.8% annualized revenue growth. This tells us the company became more profitable on a per-share basis as it expanded.
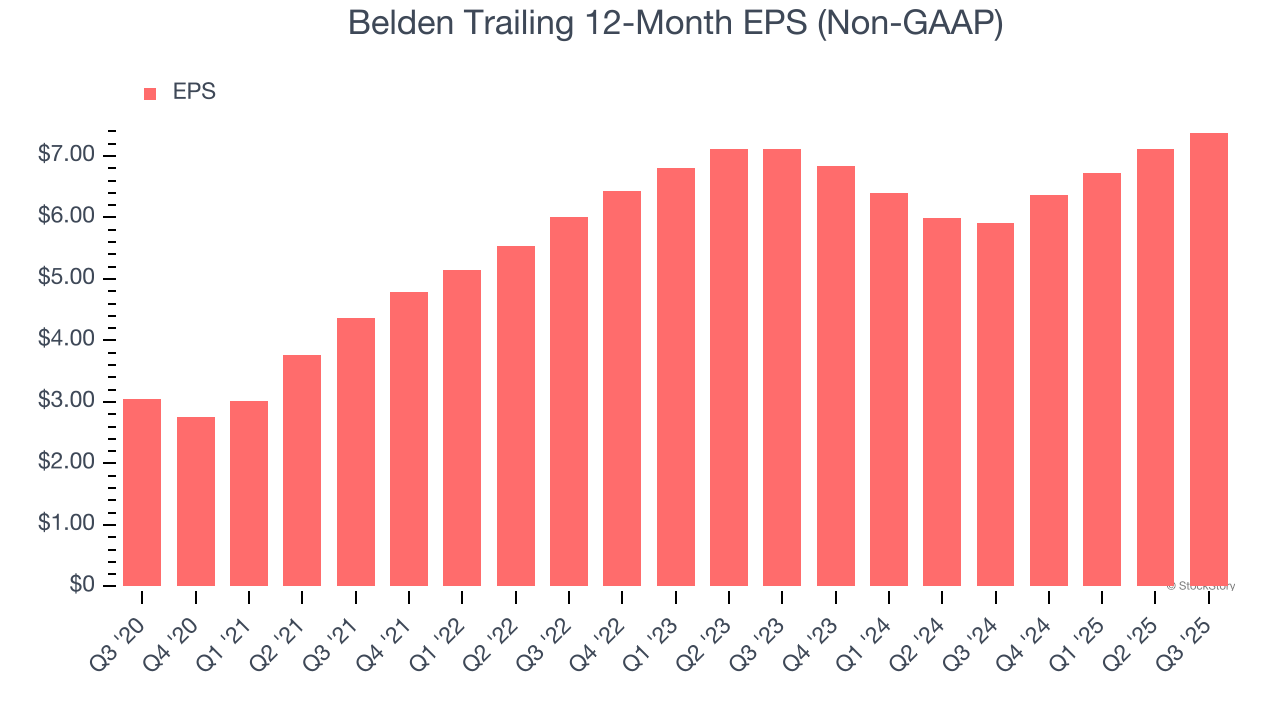
Diving into the nuances of Belden’s earnings can give us a better understanding of its performance. A five-year view shows that Belden has repurchased its stock, shrinking its share count by 10.2%. This tells us its EPS outperformed its revenue not because of increased operational efficiency but financial engineering, as buybacks boost per share earnings. 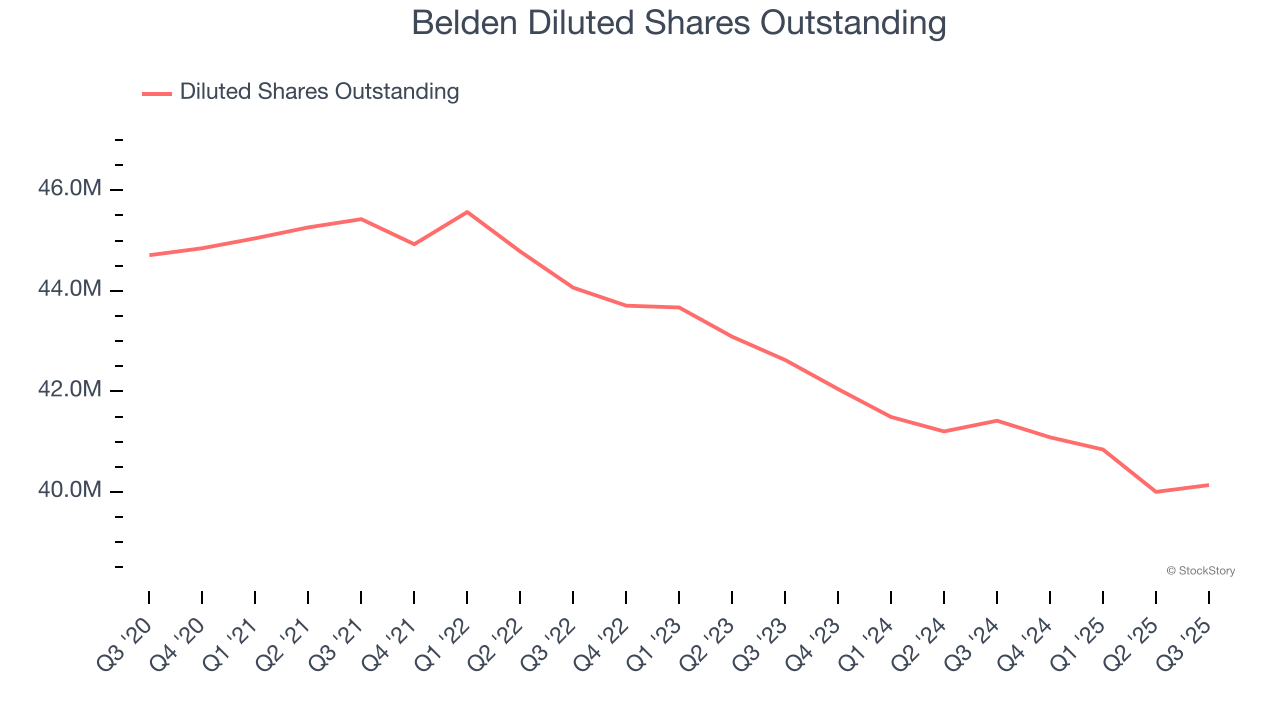
Like with revenue, we analyze EPS over a more recent period because it can provide insight into an emerging theme or development for the business.
For Belden, its two-year annual EPS growth of 1.8% was lower than its five-year trend. We hope its growth can accelerate in the future.
In Q3, Belden reported adjusted EPS of $1.97, up from $1.70 in the same quarter last year. This print beat analysts’ estimates by 2.6%. Over the next 12 months, Wall Street expects Belden’s full-year EPS of $7.38 to grow 3.8%.
Key Takeaways from Belden’s Q3 Results
We were glad Belden's revenue and EPS both outperformed Wall Street’s estimates. Looking ahead, next quarter's EPS guidance also beat. Overall, this print had some key positives. The stock traded up 4% to $124.50 immediately following the results.
Belden may have had a good quarter, but does that mean you should invest right now? We think that the latest quarter is only one piece of the longer-term business quality puzzle. Quality, when combined with valuation, can help determine if the stock is a buy. We cover that in our actionable full research report which you can read here, it’s free for active Edge members.


