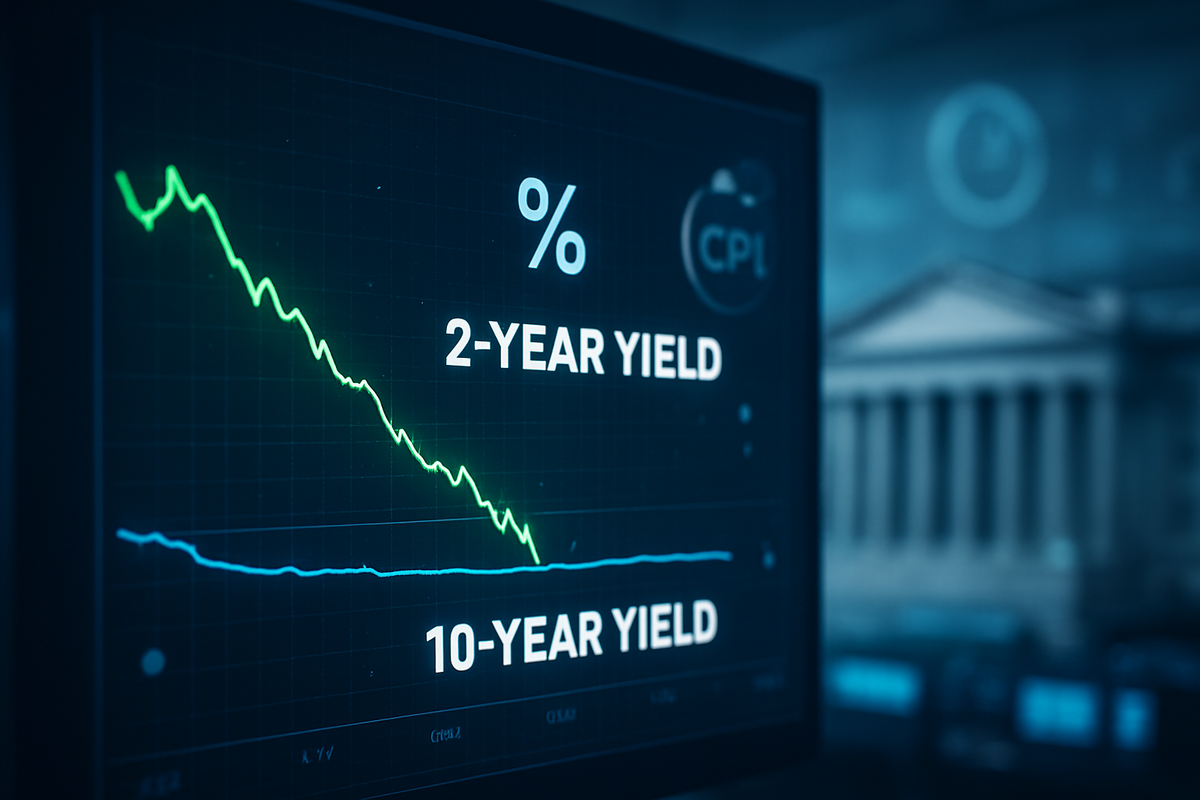
The U.S. Treasury market reacted with calculated precision on Tuesday following the release of the December Consumer Price Index (CPI) report. While the headline inflation figure remained unchanged at a 2.7% annual rate, a slight "downside surprise" in core inflation triggered a rally at the front end of the yield curve. The policy-sensitive 2-year Treasury yield slipped to 3.53%, marking a notable shift in investor sentiment regarding the Federal Reserve’s immediate path for the first quarter of 2026.
Despite the softening at the short end, long-duration bonds exhibited a "stubborn stability," with the 10-year yield holding firm near 4.18%. This widening spread between short- and long-term borrowing costs—a classic bull steepening move—suggests that while the market sees the Fed’s tightening cycle firmly in the rearview mirror, concerns over long-term fiscal health and a "political risk premium" are keeping benchmark rates elevated.
A Tale of Two Tapers: Decoding the December CPI Print
The Bureau of Labor Statistics reported on January 13, 2026, that the headline CPI rose 0.3% month-over-month. However, the real catalyst for the bond market was the Core CPI, which excludes volatile food and energy costs. Core prices rose just 0.2% in December, bringing the year-over-year core rate to 2.6%—below the 2.7% consensus forecast. This marked the lowest core reading in several months, providing ammunition for those betting on a more accommodative Fed.
The immediate reaction in the fixed-income markets was a swift bid for short-term paper. The 2-year Treasury yield, which had been hovering near 3.60% last week, cascaded down to 3.537% shortly after the 8:30 a.m. release. Investors viewed the cooling core data as a sign that "super core" services inflation might finally be breaking, reducing the pressure on the Fed to maintain its restrictive "higher-for-longer" stance.
However, the rally did not extend to the long end of the curve. The 10-year Treasury yield remained range-bound between 4.17% and 4.19%, while the 30-year yield actually edged higher to 4.85% ahead of a scheduled $22 billion bond auction. This divergence highlights a market that is increasingly decoupling short-term interest rate expectations from long-term inflation and fiscal realities. Analysts noted that the "term premium"—the extra compensation investors demand for holding longer-term debt—is returning as the market grapples with a persistent federal deficit.
Winners and Losers: Banking and Growth in the Crosshairs
The steepening of the yield curve has immediate implications for the financial sector. Large-cap banks, such as JPMorgan Chase & Co. (NYSE: JPM) and Bank of America Corp. (NYSE: BAC), typically benefit from a steeper curve, which allows them to borrow at lower short-term rates and lend at higher long-term rates, expanding their Net Interest Margin (NIM). The dip in the 2-year yield to 3.53% provides a lower cost of funding for these institutions, even as the 10-year rate provides a solid floor for mortgage and commercial loan pricing.
Conversely, the stability of long-term yields continues to pose a challenge for the real estate sector and the SPDR S&P 500 ETF Trust (NYSEARCA: SPY). While the cooling core CPI is a positive sign for consumer spending, the fact that the 10-year yield refuses to budge below 4% keeps mortgage rates prohibitively high for many prospective homebuyers. Companies in the Invesco QQQ Trust (NASDAQ: QQQ), particularly high-growth tech firms, saw a mixed reaction; the lower 2-year yield reduces the "discount rate" for future earnings, but the lack of movement in the 10-year suggests that the era of truly cheap capital is not returning anytime soon.
The iShares 20+ Year Treasury Bond ETF (NASDAQ: TLT) saw increased volatility during the session. As the long end faced selling pressure due to the upcoming bond auction, TLT struggled to match the gains seen in shorter-duration ETFs. This suggests that investors are currently more comfortable hiding in the "belly" of the curve (the 2-to-5-year range) rather than taking on the duration risk associated with 30-year bonds.
The "Powell Probe" and the New Macro Reality
The current market dynamic is complicated by factors beyond mere inflation data. The yield curve’s movement also reflects a growing "uncertainty discount" surrounding the Federal Reserve itself. Recent reports of a Department of Justice inquiry into Fed Chair Jerome Powell’s communications have introduced a rare element of political risk into the Treasury market. Analysts at CME Group (NASDAQ: CME) noted that while the FedWatch tool still shows a 95% probability of a "pause" at the January meeting, the long-term outlook is clouded by these external pressures.
Historically, a bull steepening of the yield curve—where short rates fall faster than long rates—precedes a shift in the economic cycle. However, this 2026 iteration is unique. Unlike previous cycles where a 2.6% core CPI might have triggered immediate talk of rate cuts, the Fed remains haunted by the "sticky" inflation of 2024. The current "positive spread" of roughly 64 basis points between the 2-year and 10-year indicates that the market is transitioning from recession-fear to a "stable growth with persistent inflation" narrative.
Furthermore, the persistent strength in shelter costs, which rose 0.4% in December, remains the largest hurdle for the Fed’s 2% target. Until shelter inflation shows a more meaningful decline, the "last mile" of the inflation fight remains the most difficult, preventing long-term yields from falling in tandem with their short-term counterparts.
What Comes Next: The Road to June
Looking ahead, the market is effectively "pricing out" any possibility of a rate cut in the first quarter of 2026. The 2-year yield hitting 3.53% is seen as a floor for the time being, as traders await the Fed’s next move in the spring. Current projections have shifted the "first cut" expectations from April to June 2026, as the central bank continues to demand "sustained evidence" that inflation is dead and buried.
Investors should prepare for continued "choppiness" in the bond market as the Fed navigates this transition. Short-term yields are likely to remain sensitive to every incremental piece of labor market and inflation data, while the long end will be increasingly dictated by the government’s borrowing needs and the outcome of the ongoing investigations into Fed leadership. A strategic pivot toward the middle of the curve may be the preferred play for institutional investors seeking to balance yield and risk.
Market Outlook and Final Takeaways
The reaction to the December CPI data confirms that the bond market is in a state of cautious realignment. The dip in the 2-year yield to 3.53% is a clear signal that the peak of the rate cycle is well behind us, yet the resilience of the 10-year yield serves as a reminder that the "new normal" for interest rates is significantly higher than the zero-bound era of the previous decade.
Key takeaways for the coming months:
- Watch the Spread: A further steepening of the curve will continue to favor financial stocks over capital-intensive growth sectors.
- Inflation Components: Keep a close eye on "super core" services; if this metric remains near 2.8%, the 2-year yield may find it difficult to stay below 3.50%.
- Fiscal Auctions: The success or failure of upcoming 10-year and 30-year Treasury auctions will be more critical than CPI data for determining the direction of mortgage and corporate borrowing rates.
As we move deeper into 2026, the focus will shift from "how high" rates will go to "how long" they must stay at these levels to ensure the 2% target is not just hit, but held.
This content is intended for informational purposes only and is not financial advice