As the May West Texas Intermediate futures contract heads into its final months of trading, the crude oil complex navigates an unusually volatile backdrop of geopolitical risk and predictable seasonal demand patterns. At the forefront of price drivers is the ongoing conflict involving the United States, Israel, and Iran, which has injected a meaningful geopolitical risk premium into crude valuations.
In late February and early March, a series of joint U.S. and Israeli military strikes on Iranian targets, coupled with Iranian retaliatory attacks on regional infrastructure, dramatically heightened concerns over oil supply security. The Strait of Hormuz, a critical route for roughly 20% of global seaborne crude (Brent crude) and 19% of LNG, has experienced a near-halt in commercial traffic. Following heightened tensions and threats, many tankers halted, diverted, or reversed course, with several major shipping companies pausing operations.
The impact on prices has been immediate. Front-month WTI futures climbed back above the mid-$70s per barrel region, marking the highest levels since mid-2025, as analysts priced in the likelihood of prolonged supply disruptions. Additionally, the May26:June26 WTI calendar spread had been trading near parity until January. Since the escalation, the spread has traded to a premium to May of $2.22 per barrel. Some models, including those from major investment banks Bank of America and Goldman Sachs, have suggested that a higher risk premium — on the order of $14–$18 per barrel — should persist if transit conditions remain tight. While actual physical supply losses have been limited so far, market sentiment remains sensitive to the possibility of extended outages and higher freight and insurance costs associated with Gulf transits.
This geopolitical risk builds on another structural price force: seasonal demand dynamics. The crude oil market exhibits a well-established pattern in which prices typically bottom in December and then begin a spring rally that often lasts through late April or early May. This pattern is driven in large part by refiners’ forward purchasing ahead of the Northern Hemisphere’s peak summer driving season. As vacationing consumers hit the roads from May through August, gasoline demand, the primary refined product from WTI crude, rises sharply, drawing down inventories and incentivizing refiners to accumulate crude in advance. In a recent article for Barchart, Crude Oil Breakout Backed by Seasonals, Technicals, and COT Report, I detailed this seasonal pattern and will discuss it later in this article.
Compounding seasonal demand is the transition to summer-grade gasoline. By May 1, the EPA requires that all gasoline supplied to terminals and pipelines meet the stricter summer-grade requirements. By June 1, nearly all gasoline sold at retail outlets must be summer-grade. Summer blends are formulated with lower Reid Vapor Pressure to meet tighter emissions standards, especially in high-pollution areas, and are more costly to produce. Refinery maintenance tied to this switchover also temporarily reduces output, increasing pressure on product markets and, by extension, crude prices.
For professional speculators and hedgers, these forces suggest a two-pronged framework for positioning in the May WTI contract:
- Geopolitical risk pricing remains fluid and potentially expansive if the Strait of Hormuz remains contested, creating a sustained premium for near-term crude contracts.
- Seasonal refiners’ demand and blend transitions are poised to support a constructive forward curve into May and early summer, reinforcing traditional bullish seasonal tendencies.
Technical Picture
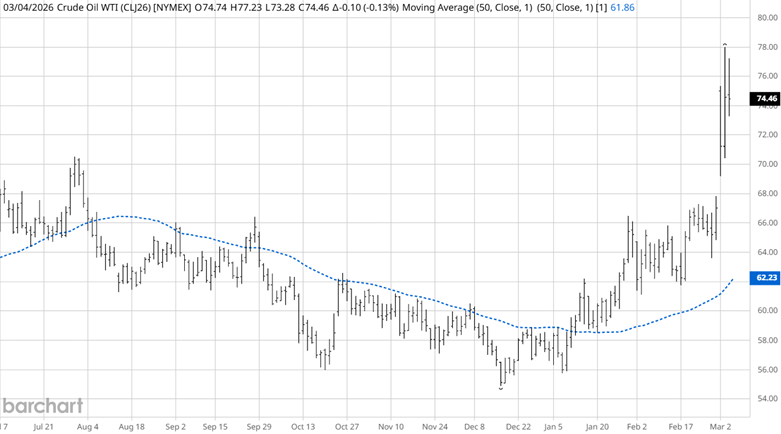
Source: Barchart
In the recent article, the daily chart of WTI had already traded above the 50 simple moving average (SMA) and turned it up. After the recent attack, prices may have moved too far from their SMA mean, suggesting a price correction.
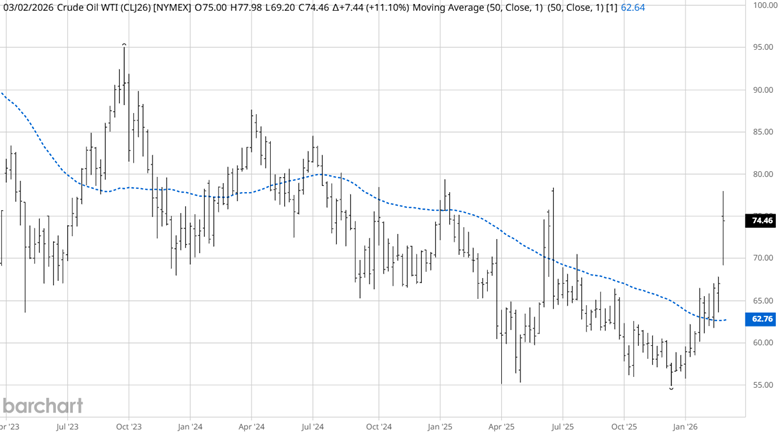
Source: Barchart
The concern at the time of the recent article was that the price was trading at the weekly SMA and had not decisively closed beyond it or shown signs that the SMA was turning up. In the interim, that article's price action is showing bullish signs of turning the weekly trend up.
Disaggregated Commitment of Traders Report (COT)
The recent article revealed that the commercial traders had been accumulating long positions in the WTI futures contracts. Commercials typically dollar-cost-average and create the tops and bottoms in our markets. Once a trend is evident, then managed money (trend followers) typically begin entering the market. Unfortunately, it wasn’t just the managed money traders seeing this trend develop, but also the non-reportable traders (usually referred to as retail traders).
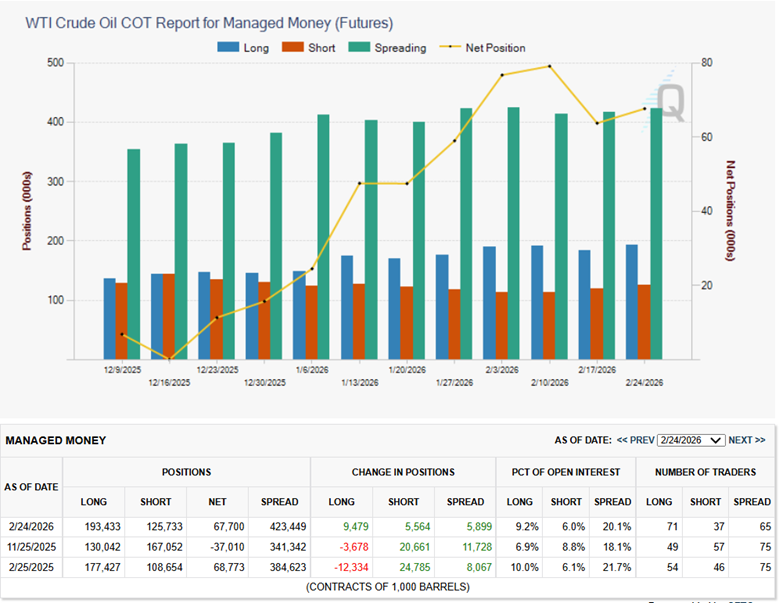
Source: CME Group Exchange
Since the beginning of the year, managed money has held elevated long positions (blue bars). Managed money typically keeps the trend moving with its large capital base.
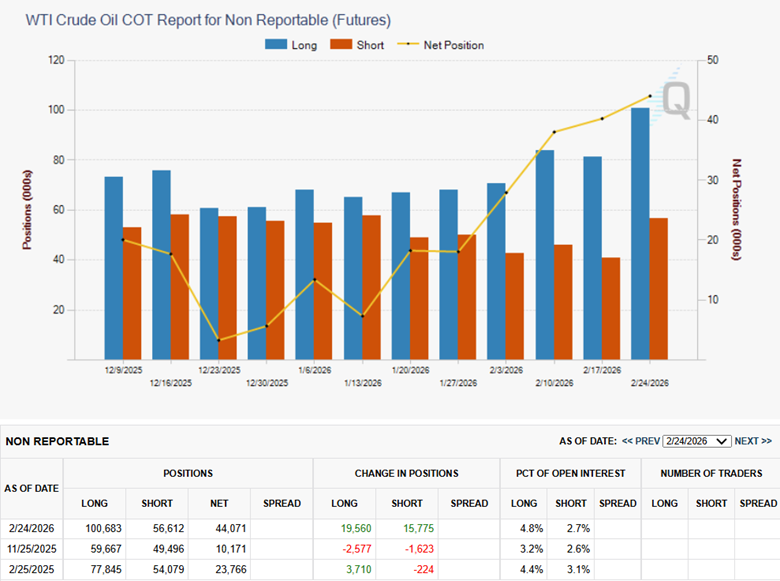
Source: CME Group Exchange
The last three weeks have shown that non-reportable traders have aggressively been buying WTI futures contracts. Typically, this is seen as a bearish scenario and usually results in a price correction.
As the daily WTI chart shows, prices are trading a significant distance from their SMA, and the recent non-reportable trader buying spree, the WTI market may be poised for a slight pullback, which aligns with the upcoming seasonal analysis.
Seasonal Pattern
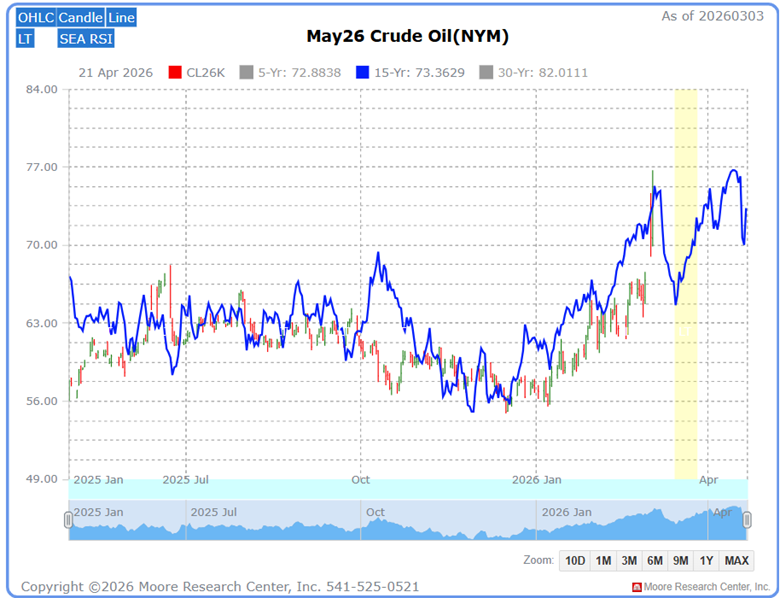
In a recent article, Moore Research Center, Inc. (MRCI) identified a seasonal buying pattern (yellow box) in the WTI market. The results of that research are shown in the next chart.
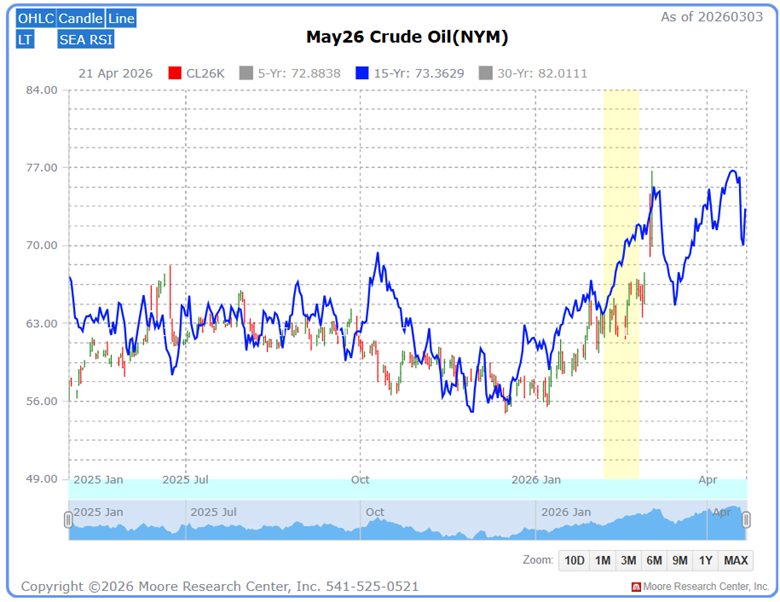
Source: Moore Research Center, Inc. (MRCI)
Source: MRCI
MRCI’s research has found that the May WTI contract for the past 15 years (blue line) has begun a price correction in early March. The current year has the added edge of the daily price being significantly above its SMA, and non-reportable traders have been overly bullish. This could be the catalyst for price drops before another seasonal buying window (yellow box) opens.
The seasonal buying window research shows that WTI has closed higher on about March 26 than on March 15 for 12 of the past 15 years, an 80% occurrence. During this 12-calendar-day window, the pattern has returned $2.52 in hypothetical profits, or $2,515.33 per contract.
As a crucial reminder, while seasonal patterns can provide valuable insights, they should not be the basis for trading decisions. Traders must consider various technical and fundamental indicators, risk management strategies, and market conditions to make informed, balanced trading decisions.
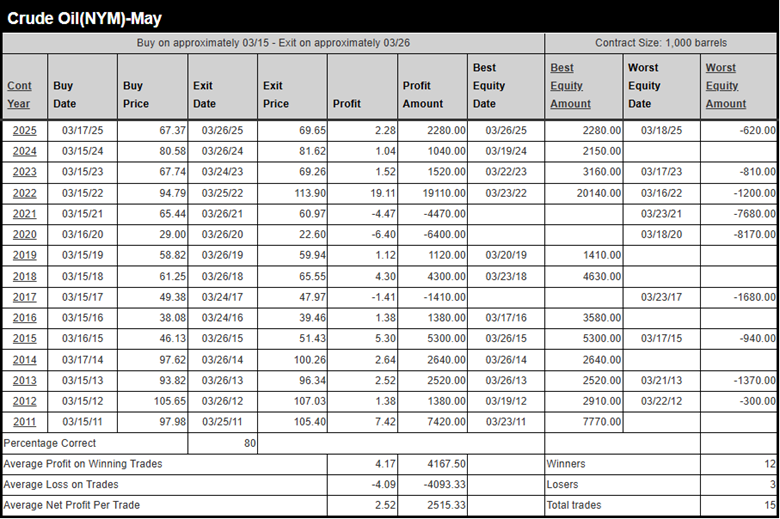
Source: MRCI
Examining the Worst Equity Amount column, we see that this seasonal buy pattern occurred in 6 of the past 15 years, with no daily closing drawdown.
Assets to Trade the WTI Crude Oil Market
Futures market traders could trade the standard-size (CL) crude oil contract, the mini (QM) contract, or the micro (CY) contract. Equity traders may be interested in trading the exchange-traded fund (USO). Options on crude oil futures or the USO ETF are also available.
In Closing….
As the May WTI contract approaches expiration, the market stands at a crossroads where geopolitics, seasonality, positioning, and technical factors are all exerting influence. The embedded risk premium stemming from Middle East tensions and uncertainty surrounding the Strait of Hormuz remains justified. Still, history also suggests that early-March corrections are common even within broader spring uptrends. With non-reportable traders recently pressing the long side and price stretched above key moving averages, the setup at least suggests a potential tactical retracement. At the same time, refinery demand, the shift to summer-grade gasoline, and statistically favorable late-March seasonals continue to underpin the larger framework.
On the date of publication, Don Dawson did not have (either directly or indirectly) positions in any of the securities mentioned in this article. All information and data in this article is solely for informational purposes. For more information please view the Barchart Disclosure Policy here.
More news from Barchart
- WTI Crude Oil May Futures — Geopolitical Turmoil Meets Seasonal Demand
- Will We See the Stickers Again?
- As Crude Oil Prices Spike Amid U.S.-Iran Conflict, Warren Buffett Once Warned that the Government Is ‘Exceptional’ at ‘Printing Money and Creating Promises’ But Can’t ‘Print Gold or Create Oil’
- Why the Charts Say It Might Be Time for a Big Short on Google Stock