
Following a summer of strong performance in the aviation sector, the repercussions of the global pandemic are seen to be in the past. However, escalating fuel prices and associated expenses project to erode airline profits. In light of these factors, and with a specific focus on American Airlines Group Inc. (AAL), this analysis will take an in-depth look at its future expectations.
The U.S. air travel market experienced an unparalleled passenger influx this summer, reflecting a robust comeback from the travel hiatus during the pandemic. Conversely, the industry faces challenges brought about by a recent decrease in domestic demand and an upsurge in fuel and labor costs.
Consequently, AAL was compelled to revise its earnings forecast for the third quarter downwards. Initially, the firm anticipated adjusted earnings per share to range between 85 cents and 95 cents. However, the new estimate places this expectation between 20 cents and 30 cents.
To glean a more comprehensive understanding of AAL's financial prospects amid the ongoing conditions, let’s look at the trends of AAL’s key financial metrics to understand why it could be wise to wait for an entry point in the stock.
American Airlines Group Inc. Financial Performance: A Comprehensive Analysis of Key Metrics (2020-2023)
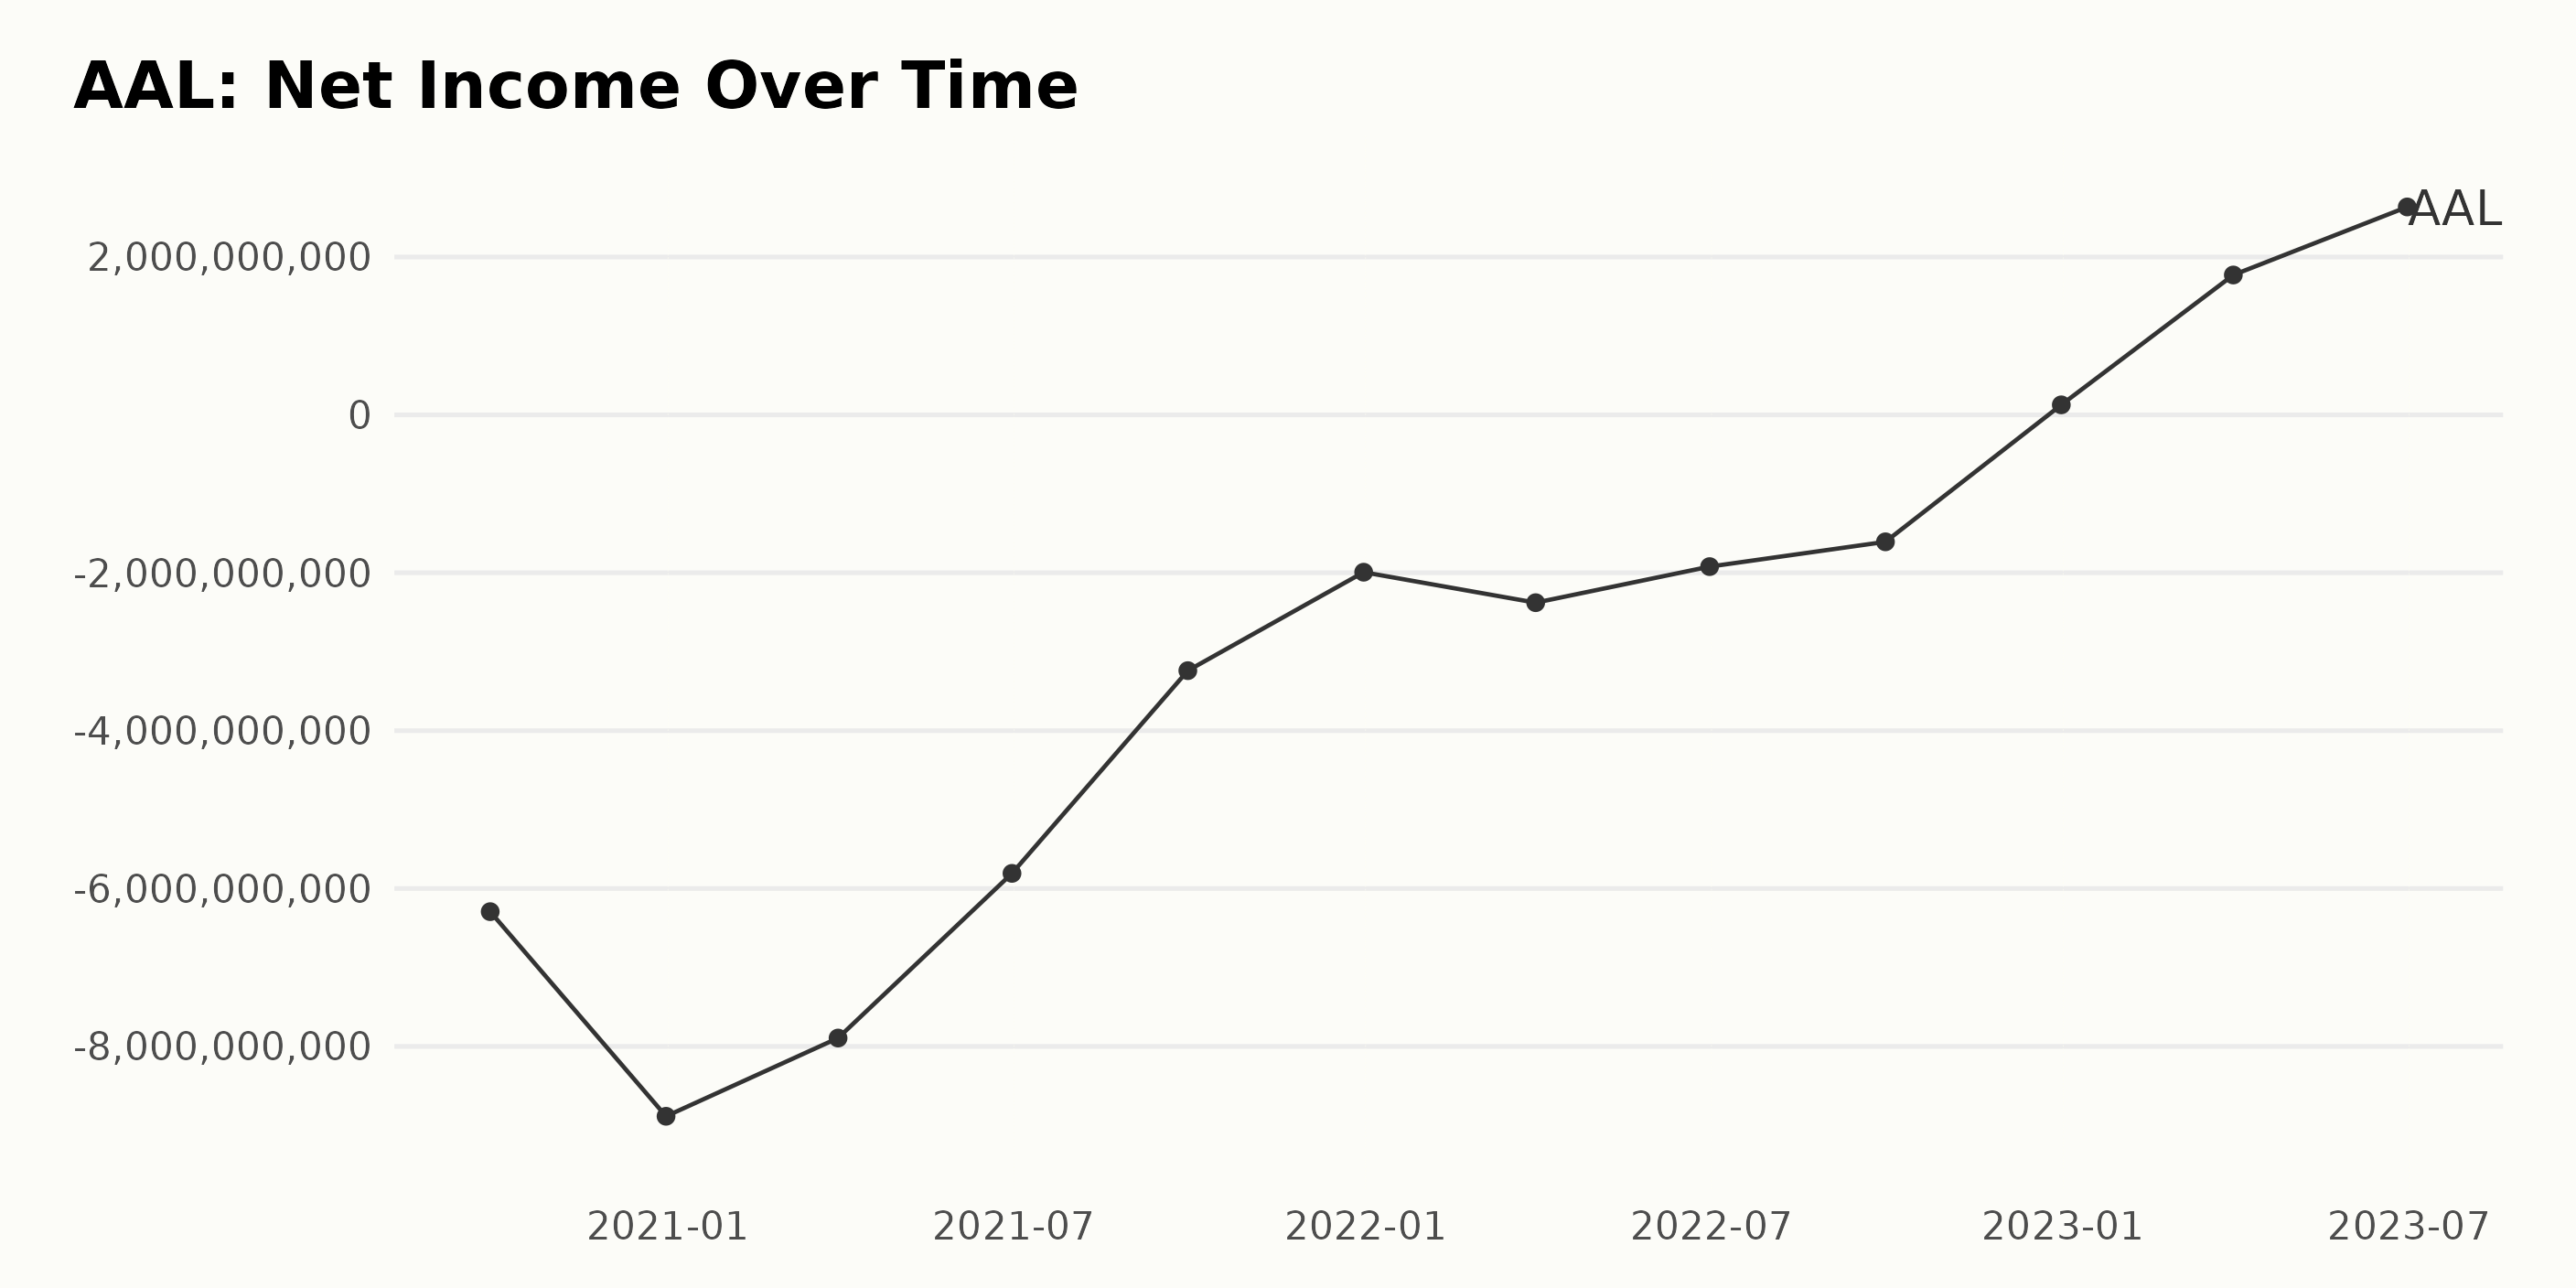
The trend for the trailing-12-month net income of AAL demonstrated fluctuations and overall positive growth over the period.
- At the start of the data series on September 30, 2020, the net income was at a negative value of -$6.29 billion.
- It then fluctuated with increasing negative values, reaching as high as -$8.88 billion by December 31, 2020.
- From there, it saw a gradual reduction in losses throughout 2021, ending the year with a net income of -$1.99 billion on December 31, 2021.
- The losses continued to decrease into 2022 until eventually reaching the positive territory with a net income of $127 million on December 31, 2022.
- Following this turnaround, AAL saw consistent positive income in 2023, ending the period covered by the data series with a net income of $2.63 billion on June 30, 2023.
Overall, AAL traversed from a net income of -$6.29 billion on September 30, 2020, to $2.63 billion on June 30, 2023. This signifies a noteworthy turn-around and indicates an impressive recovery for the company.
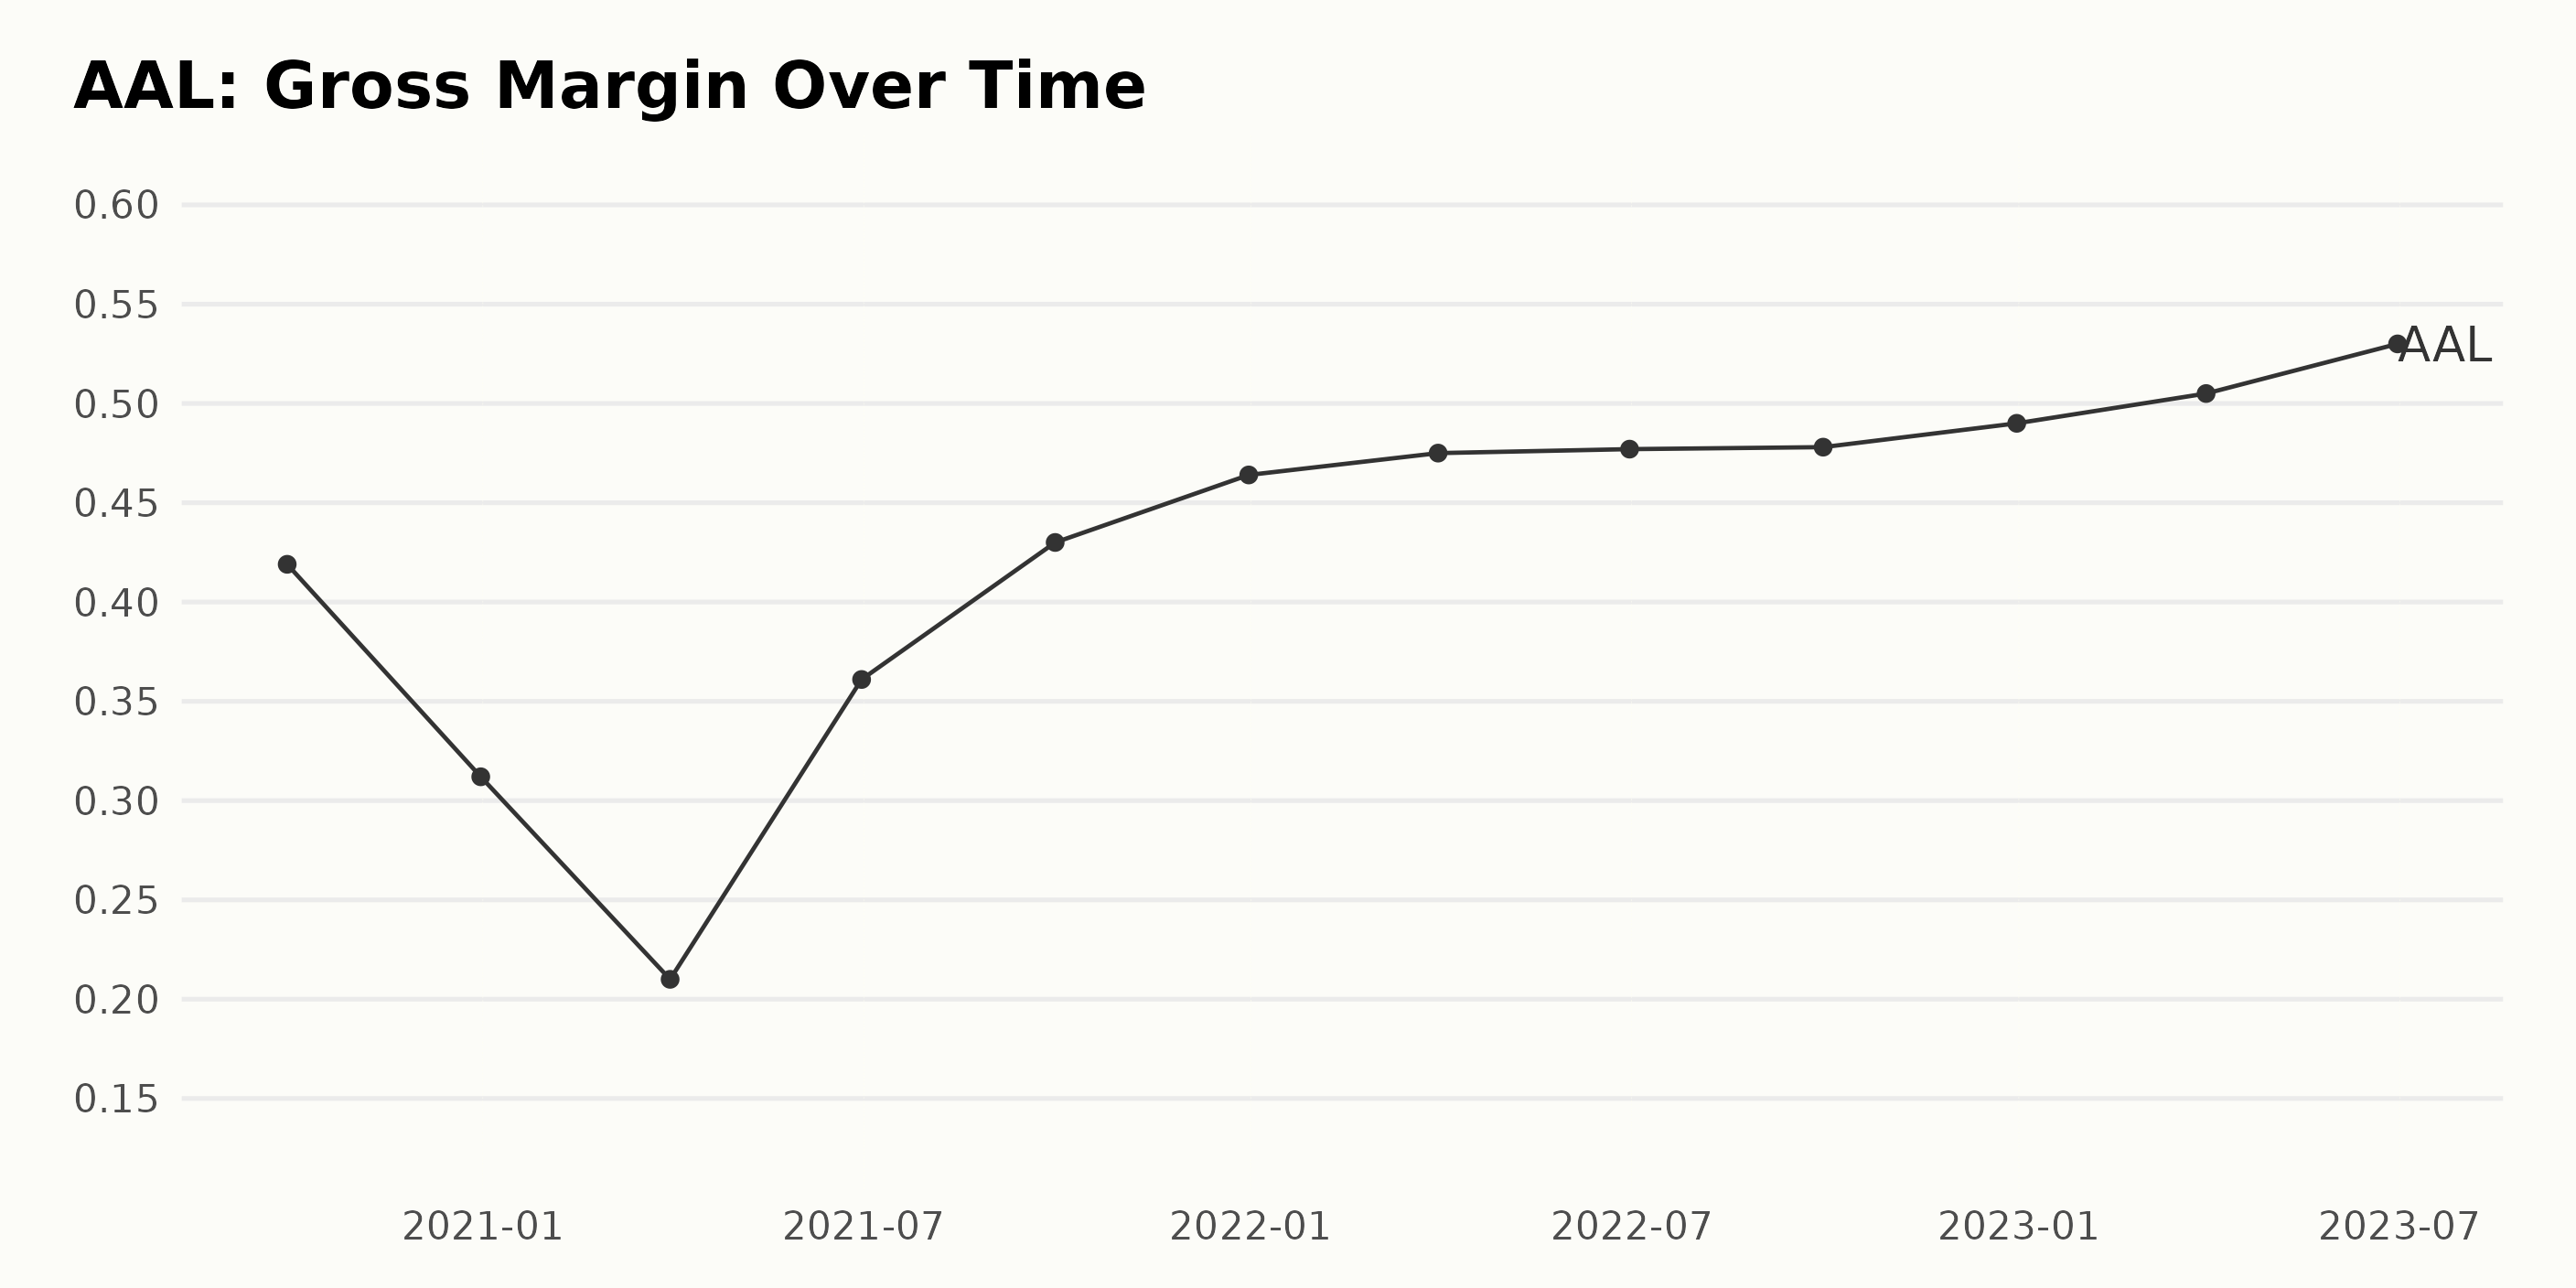
The gross margin of AAL has generally shown an upward trend during the period from September 30, 2020, through June 30, 2023.
- On September 30, 2020, the gross margin was 41.90%.
- There were fluctuations over the next quarters, with the gross margin decreasing to 31.20% by December 31, 2020, and further down to 21.00% by March 31, 2021.
- However, by June 30, 2021, there was a noticeable rebound to 36.10% before hitting 43.00% by September 30, 2021. By the end of 2021, on December 31, the gross margin increased to 46.40%.
- This upward trend continued into 2022, with the gross margin increasing slightly quarter-on-quarter, culminating in 47.80% by September 30, 2022, and then reaching 49.00% by year-end.
- In the first half of 2023, the gross margin attained new highs at 50.50% by March 31 and 53.00% by June 30, 2023.
Over the entire series, the growth rate of gross margin, measuring from 41.90% in September 2020 to 53.00% in June 2023, is approximately 26%. This summarizes the generally positive trend and intermittent gross margin fluctuations over the observed period.
The more recent data reflects a steady increase, indicating that the company has been progressively improving its profitability after a significant drop in early 2021.
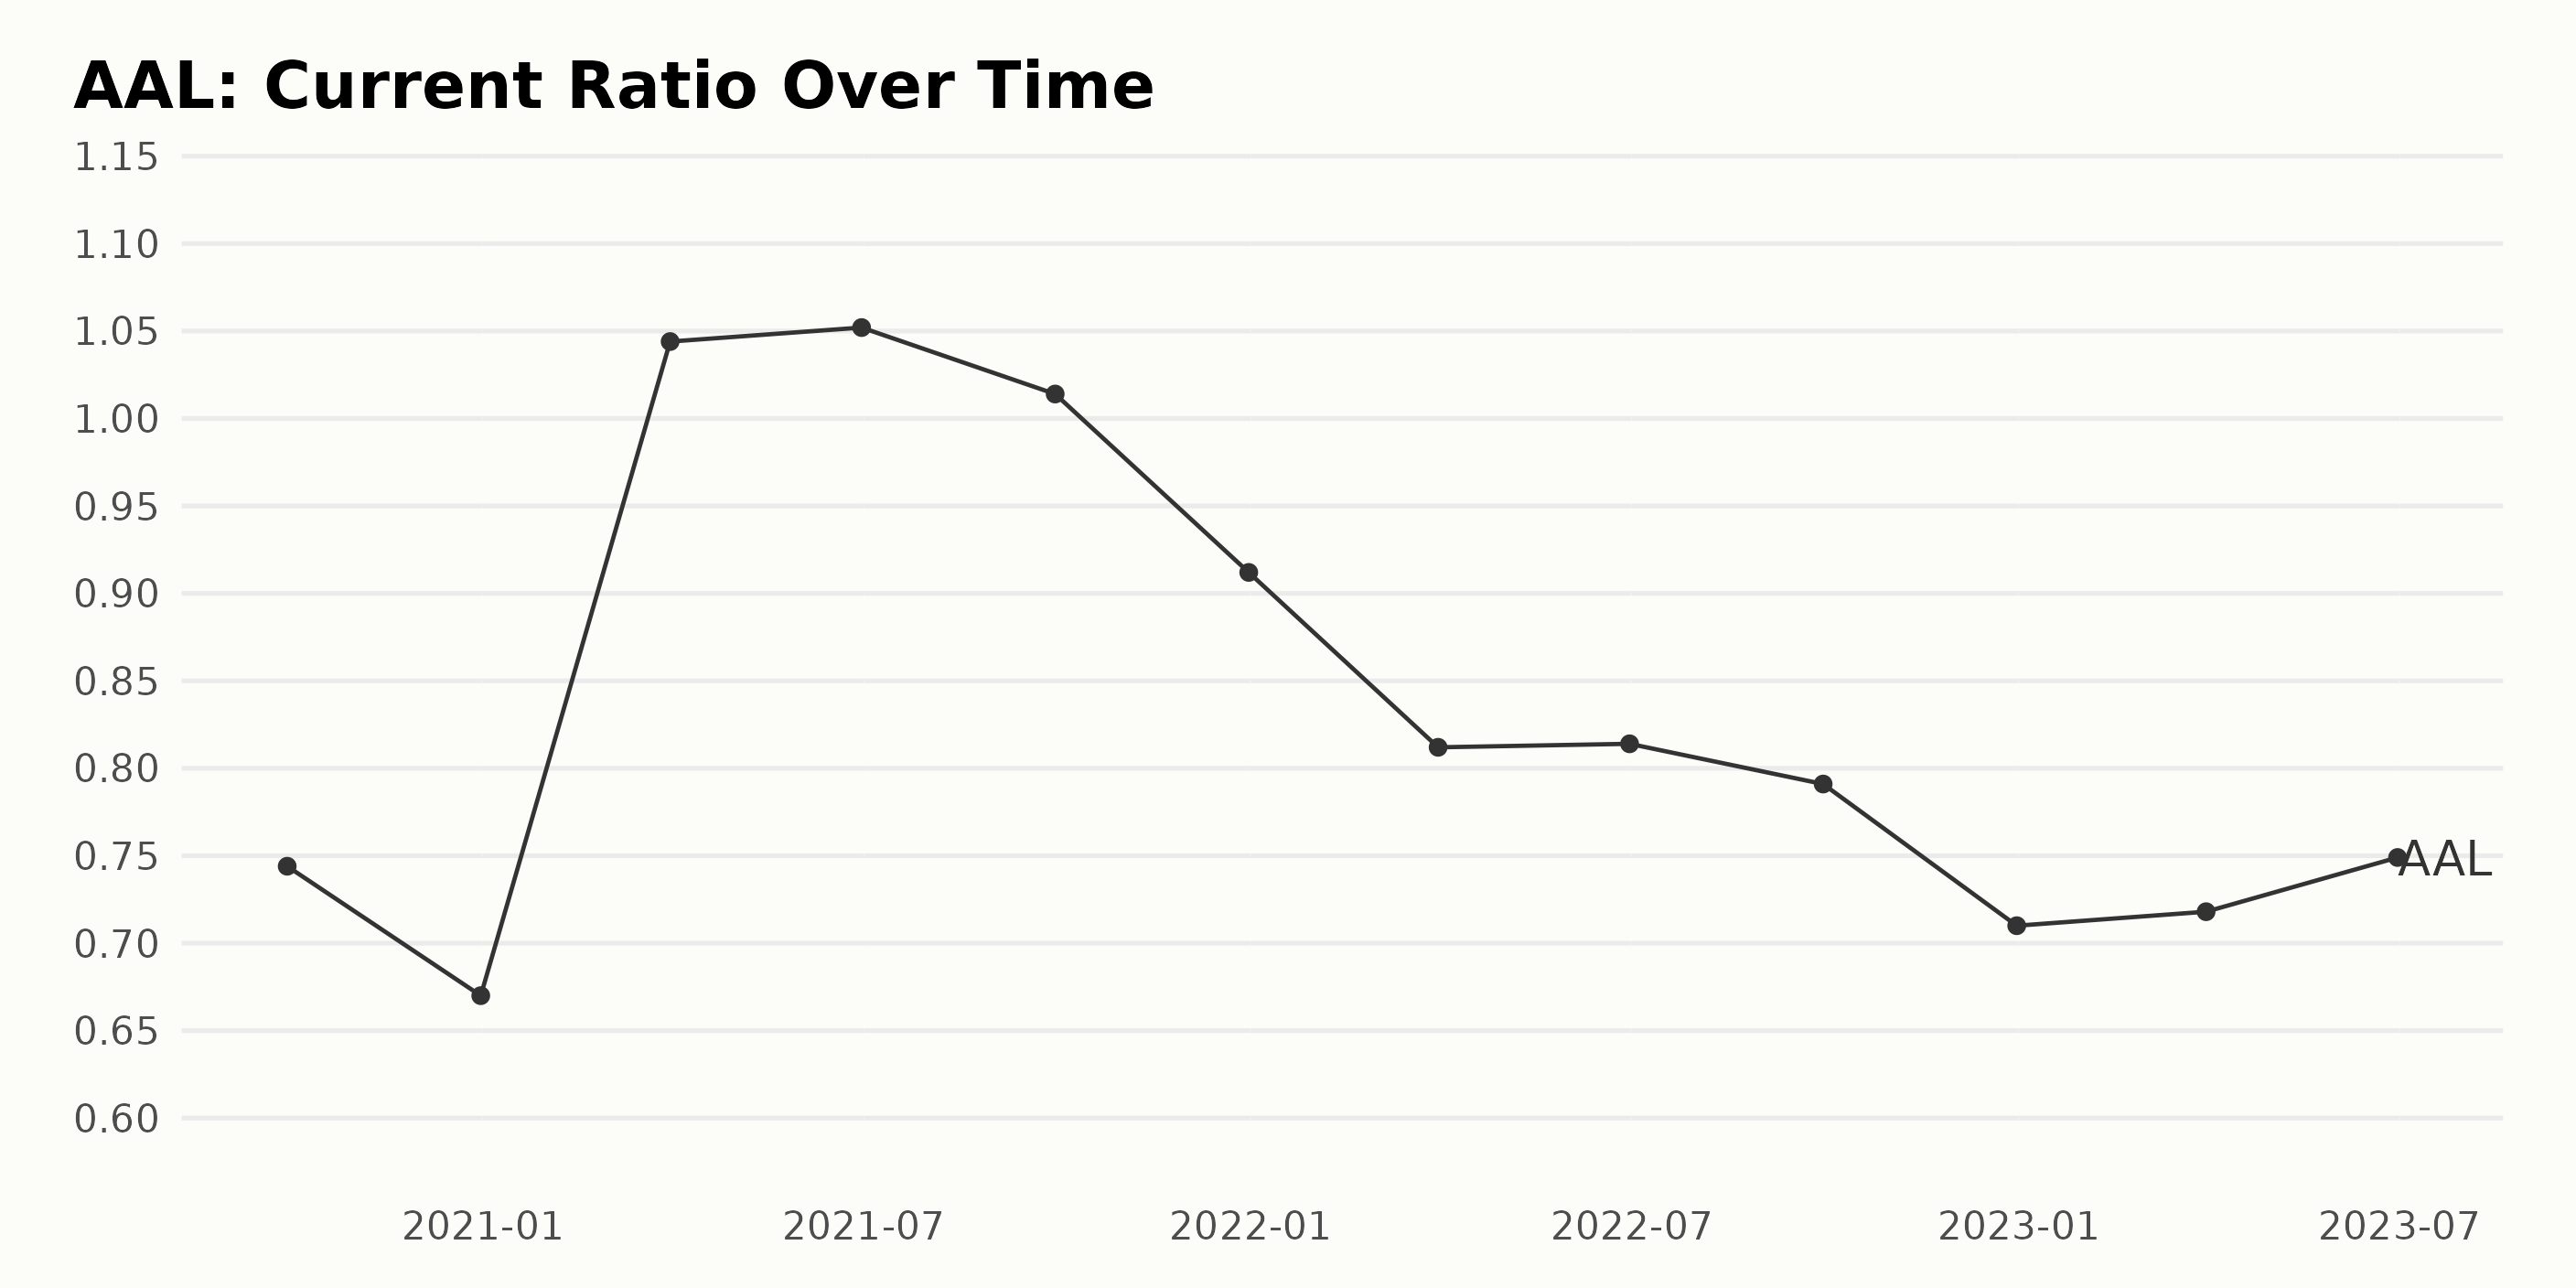
The current ratio of AAL from September 2020 through June 2023 exhibits an overall descending trend interspersed with intermittent fluctuations.
Highlights:
- Beginning at 0.744 in September 2020, the current ratio saw a minor dip to 0.67 by December 2020.
- Then, it saw a notable surge, reaching 1.052 in June 2021.
- The figure then moved in a zigzag manner from 1.014 in September 2021, reaching 0.712 by December 2022.
- The current ratio witnessed a slight recovery towards 0.749 by June 2023 despite experiencing marginal dips along the way.
In terms of growth rate, there was a slight decrease of approximately 4% from the beginning (0.744) to the endpoint of the timeframe covered (0.749). While temporary peaks and troughs are observed within this period, the overarching trend leans toward a gradual decline.
The most recent data point as of June 2023 placed the current ratio of AAL at 0.749, which indicates improved liquidity status compared to the preceding six-month period.
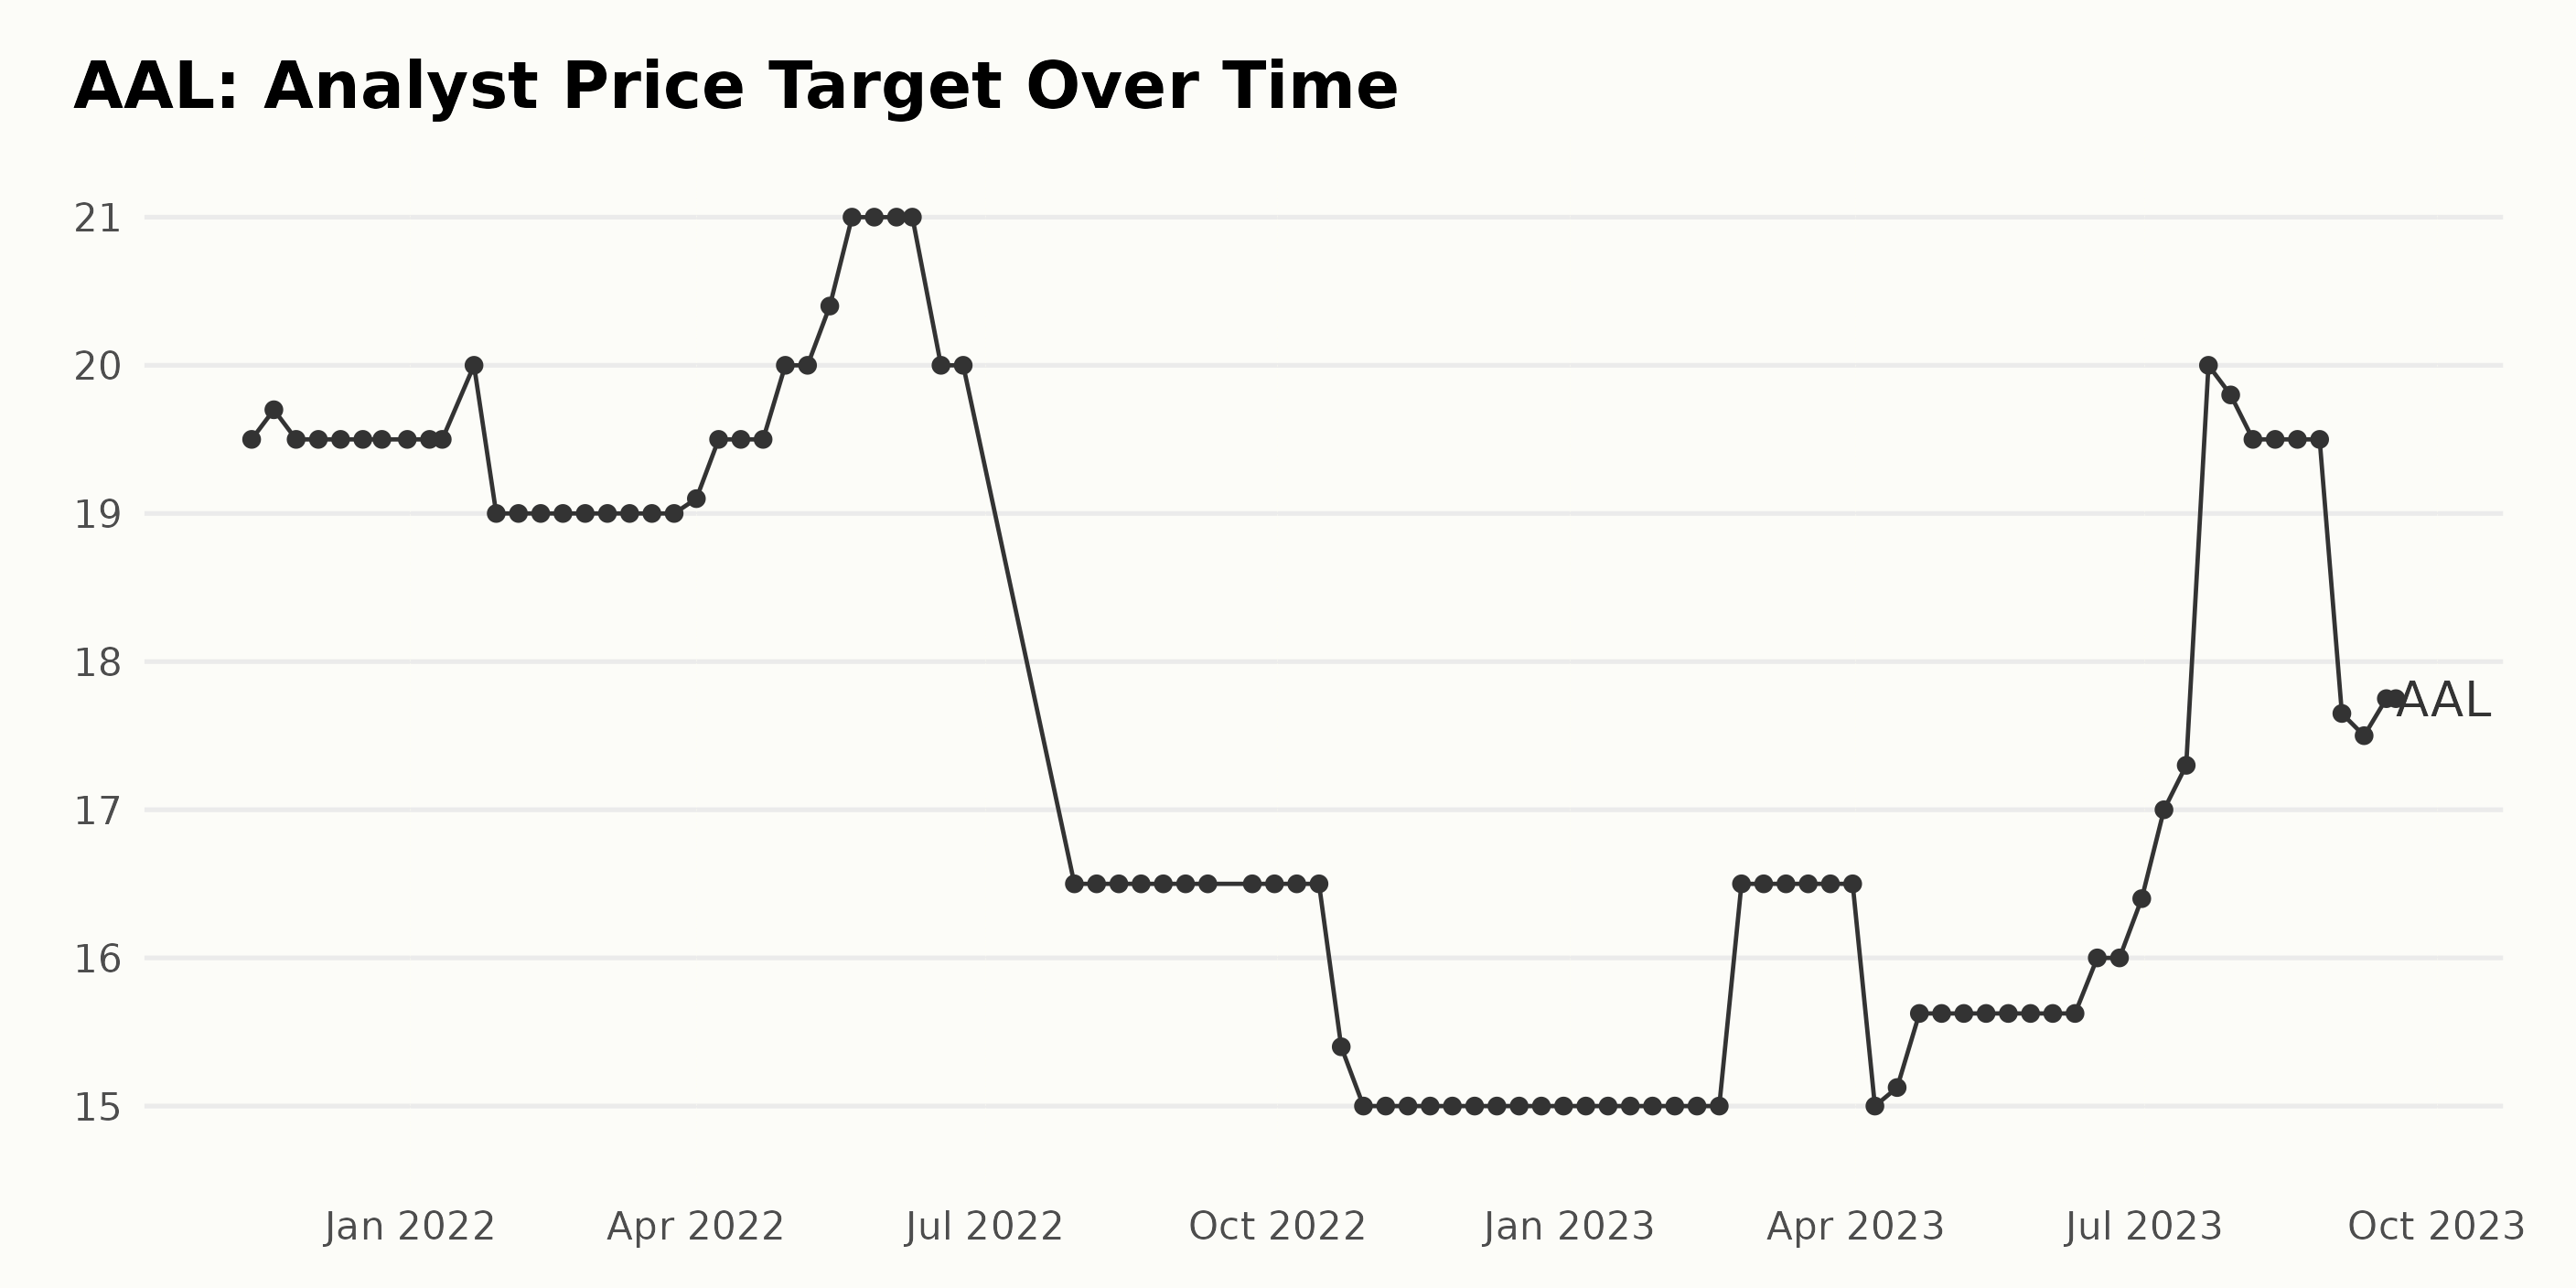
AAL’s analyst price target shows various fluctuations from November 2021 to September 2023.
- Started at $19.5 on November 12, 2021.
- The first notable rise was up to $20 on January 21, 2022.
- Saw a drop to $19 on January 28, 2022, which remained steady until April 1, 2022, when it slightly increased to $19.1.
- Reached a peak of $21 on May 20, 2022, maintaining this value until June 8, 2022.
- Dropped to $16.5 by July 29, 2022, and hadn't seen substantial increases until February 24, 2023, when it rose back up to $16.5 after consistent declines.
- Plummeted once more to $15 on April 7, 2023.
- Experience a surge to $20 by July 21, 2023.
- However, by September 1, 2023, the analyst price target had dipped to $17.65, ending the period in focus with a slight increase to $17.75 on September 18, 2023.
From the first recorded value to the last, the series experienced a decrease overall. The growth rate by comparing the first ($19.5 on November 12, 2021) and the last value ($17.75 on September 18, 2023) suggests a negative growth rate, showing a reduction of $1.75 or approximately -9% over the duration of almost two years. The most recent data indicates that the analyst price target for AAL has been on a downward trend since its peak in May 2022.
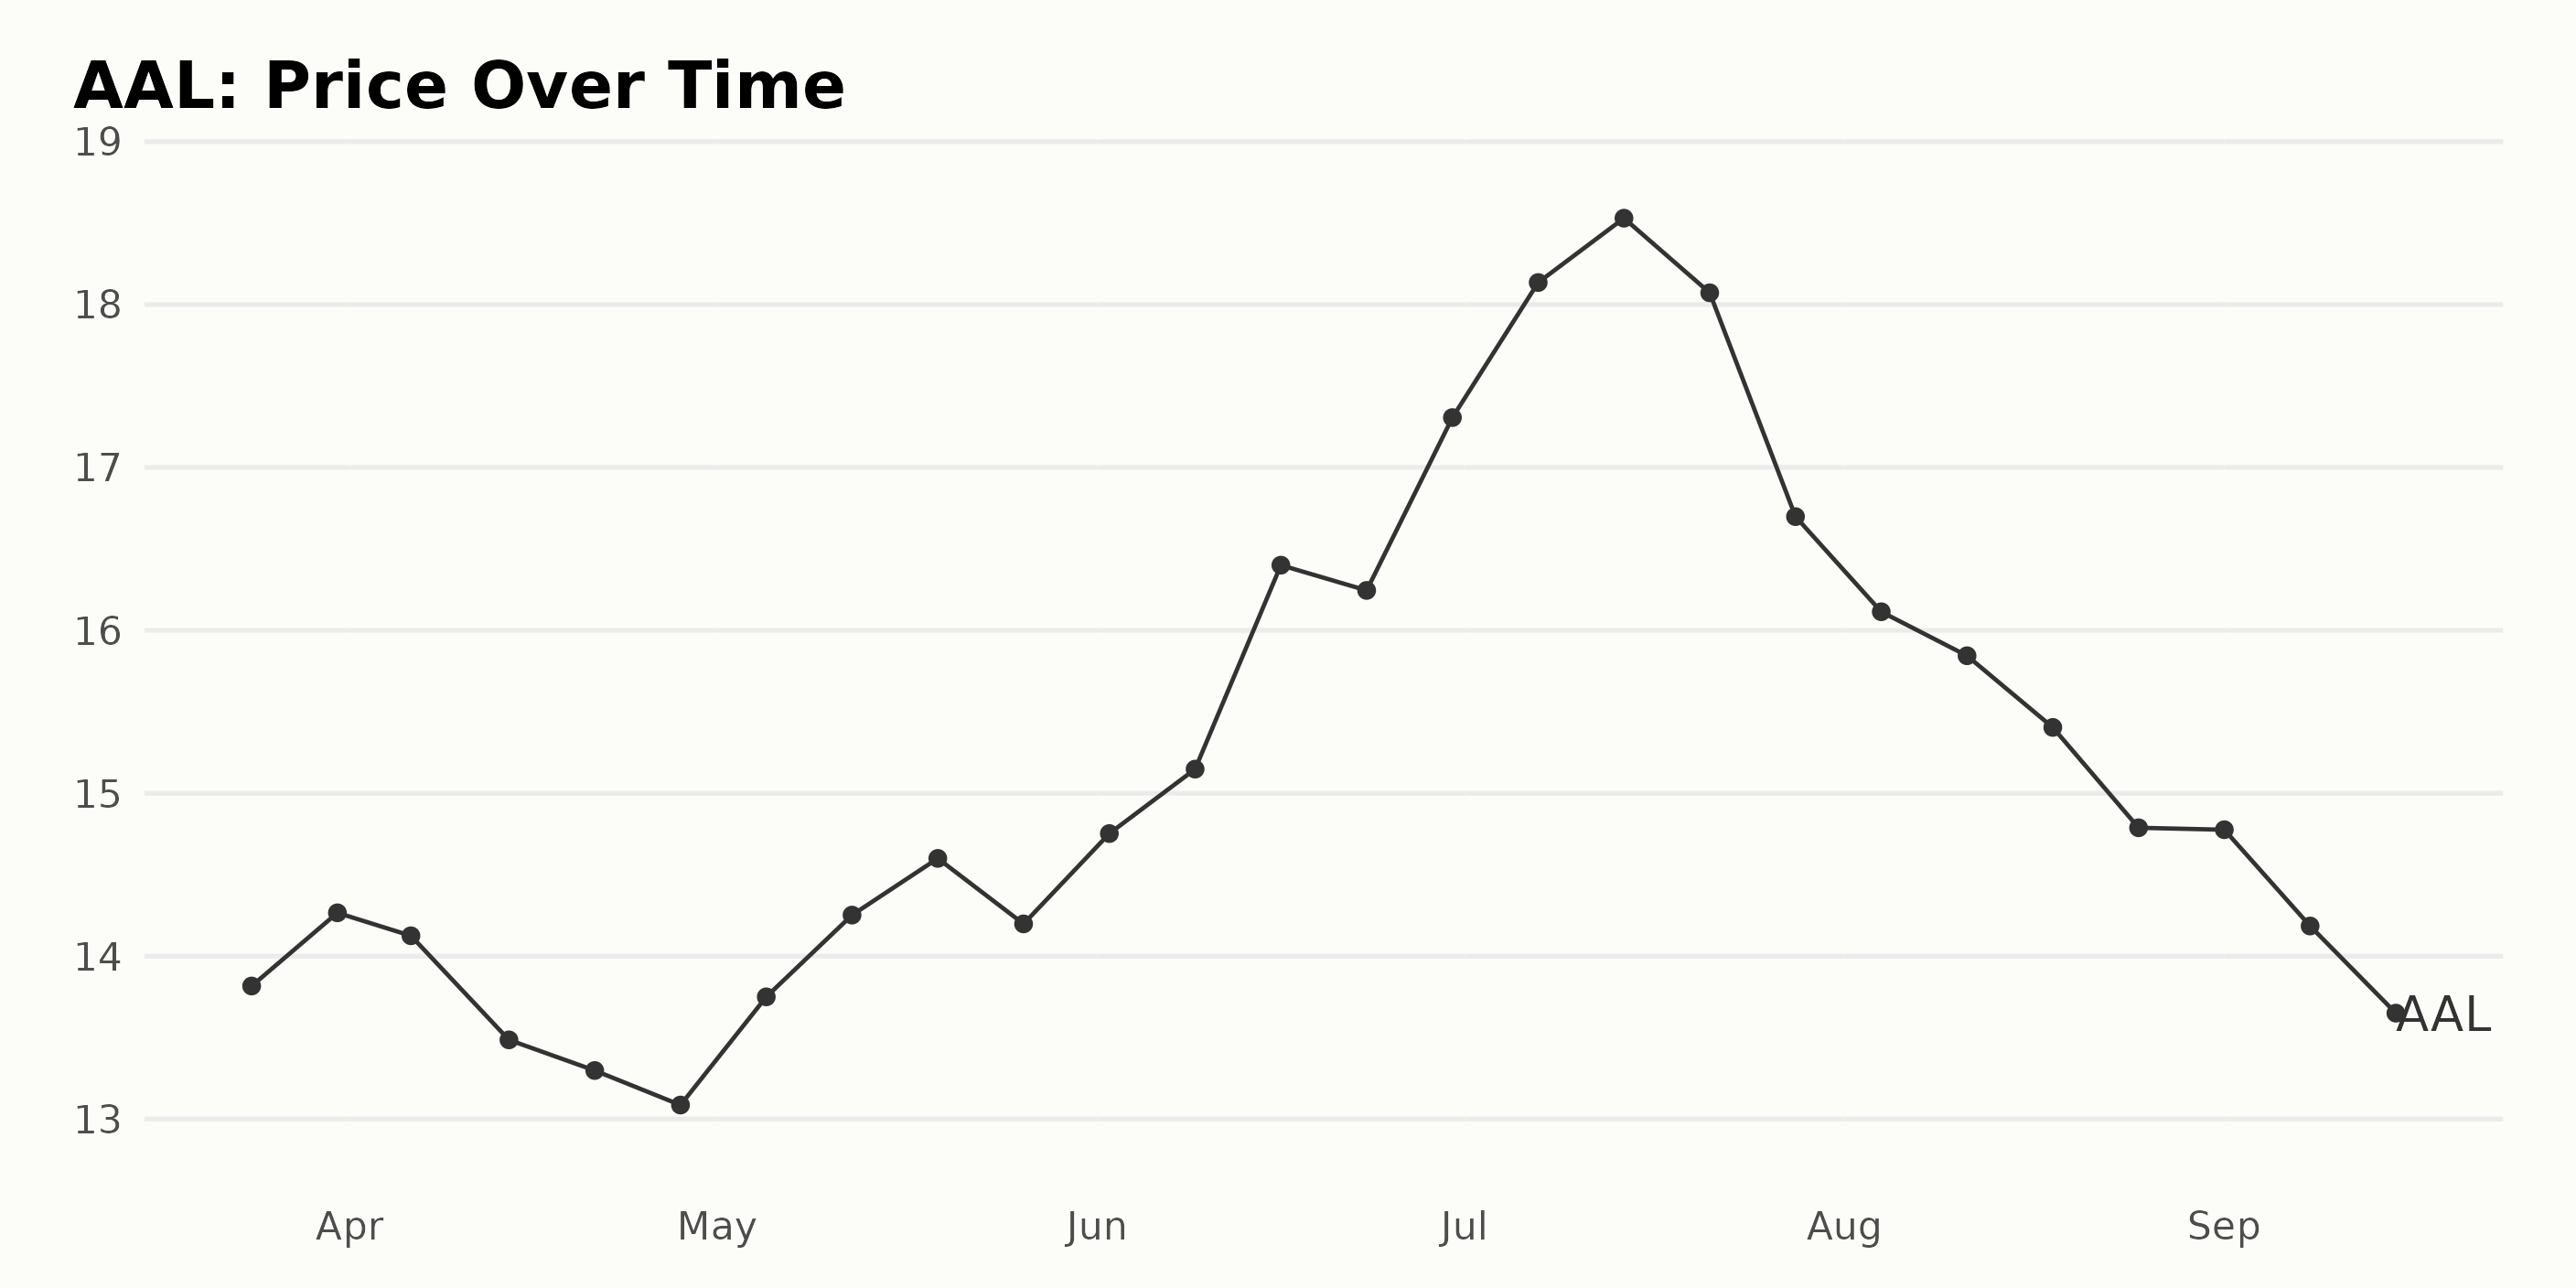
Tracking the Volatility: American Airlines' Share Price Trends from March-September 2023
The share prices of AAL showed several trends and shifts across the data reviewed between March 24 and September 15, 2023.
- Starting from $13.82 on March 24, 2023, there was a slight increase to $14.27 by March 31, 2023, which marked a growth rate of about 3.26%.
- After a minor dip in early April, prices fell more significantly from $14.13 on April 6 to $13.09 by April 28, showing a decelerating trend.
- The trend reversed, with prices increasing consistently from May 5 ($13.75), reaching up to $16.40 on June 16, 2023. This showed signs of an accelerating trend.
- This pattern continued with a slight dip in the week of June 23 at $16.24, followed by a swift acceleration to $18.53 on July 14, 2023. This period marked the highest value on record for the period analyzed, showcasing a strong upward trend.
- However, after peaking in mid-July, AAL shares began a consistent decline, dropping to $16.70 on July 28 and even further to $14.78 on August 25, 2023.
- The price slightly decreased until September 15, 2023, when the price reached $13.31.
Throughout this period, AAL experienced several trends with periods of both acceleration and deceleration. Overall, there is a high degree of volatility observable in the AAL stock during this period. Here is a chart of AAL's price over the past 180 days.
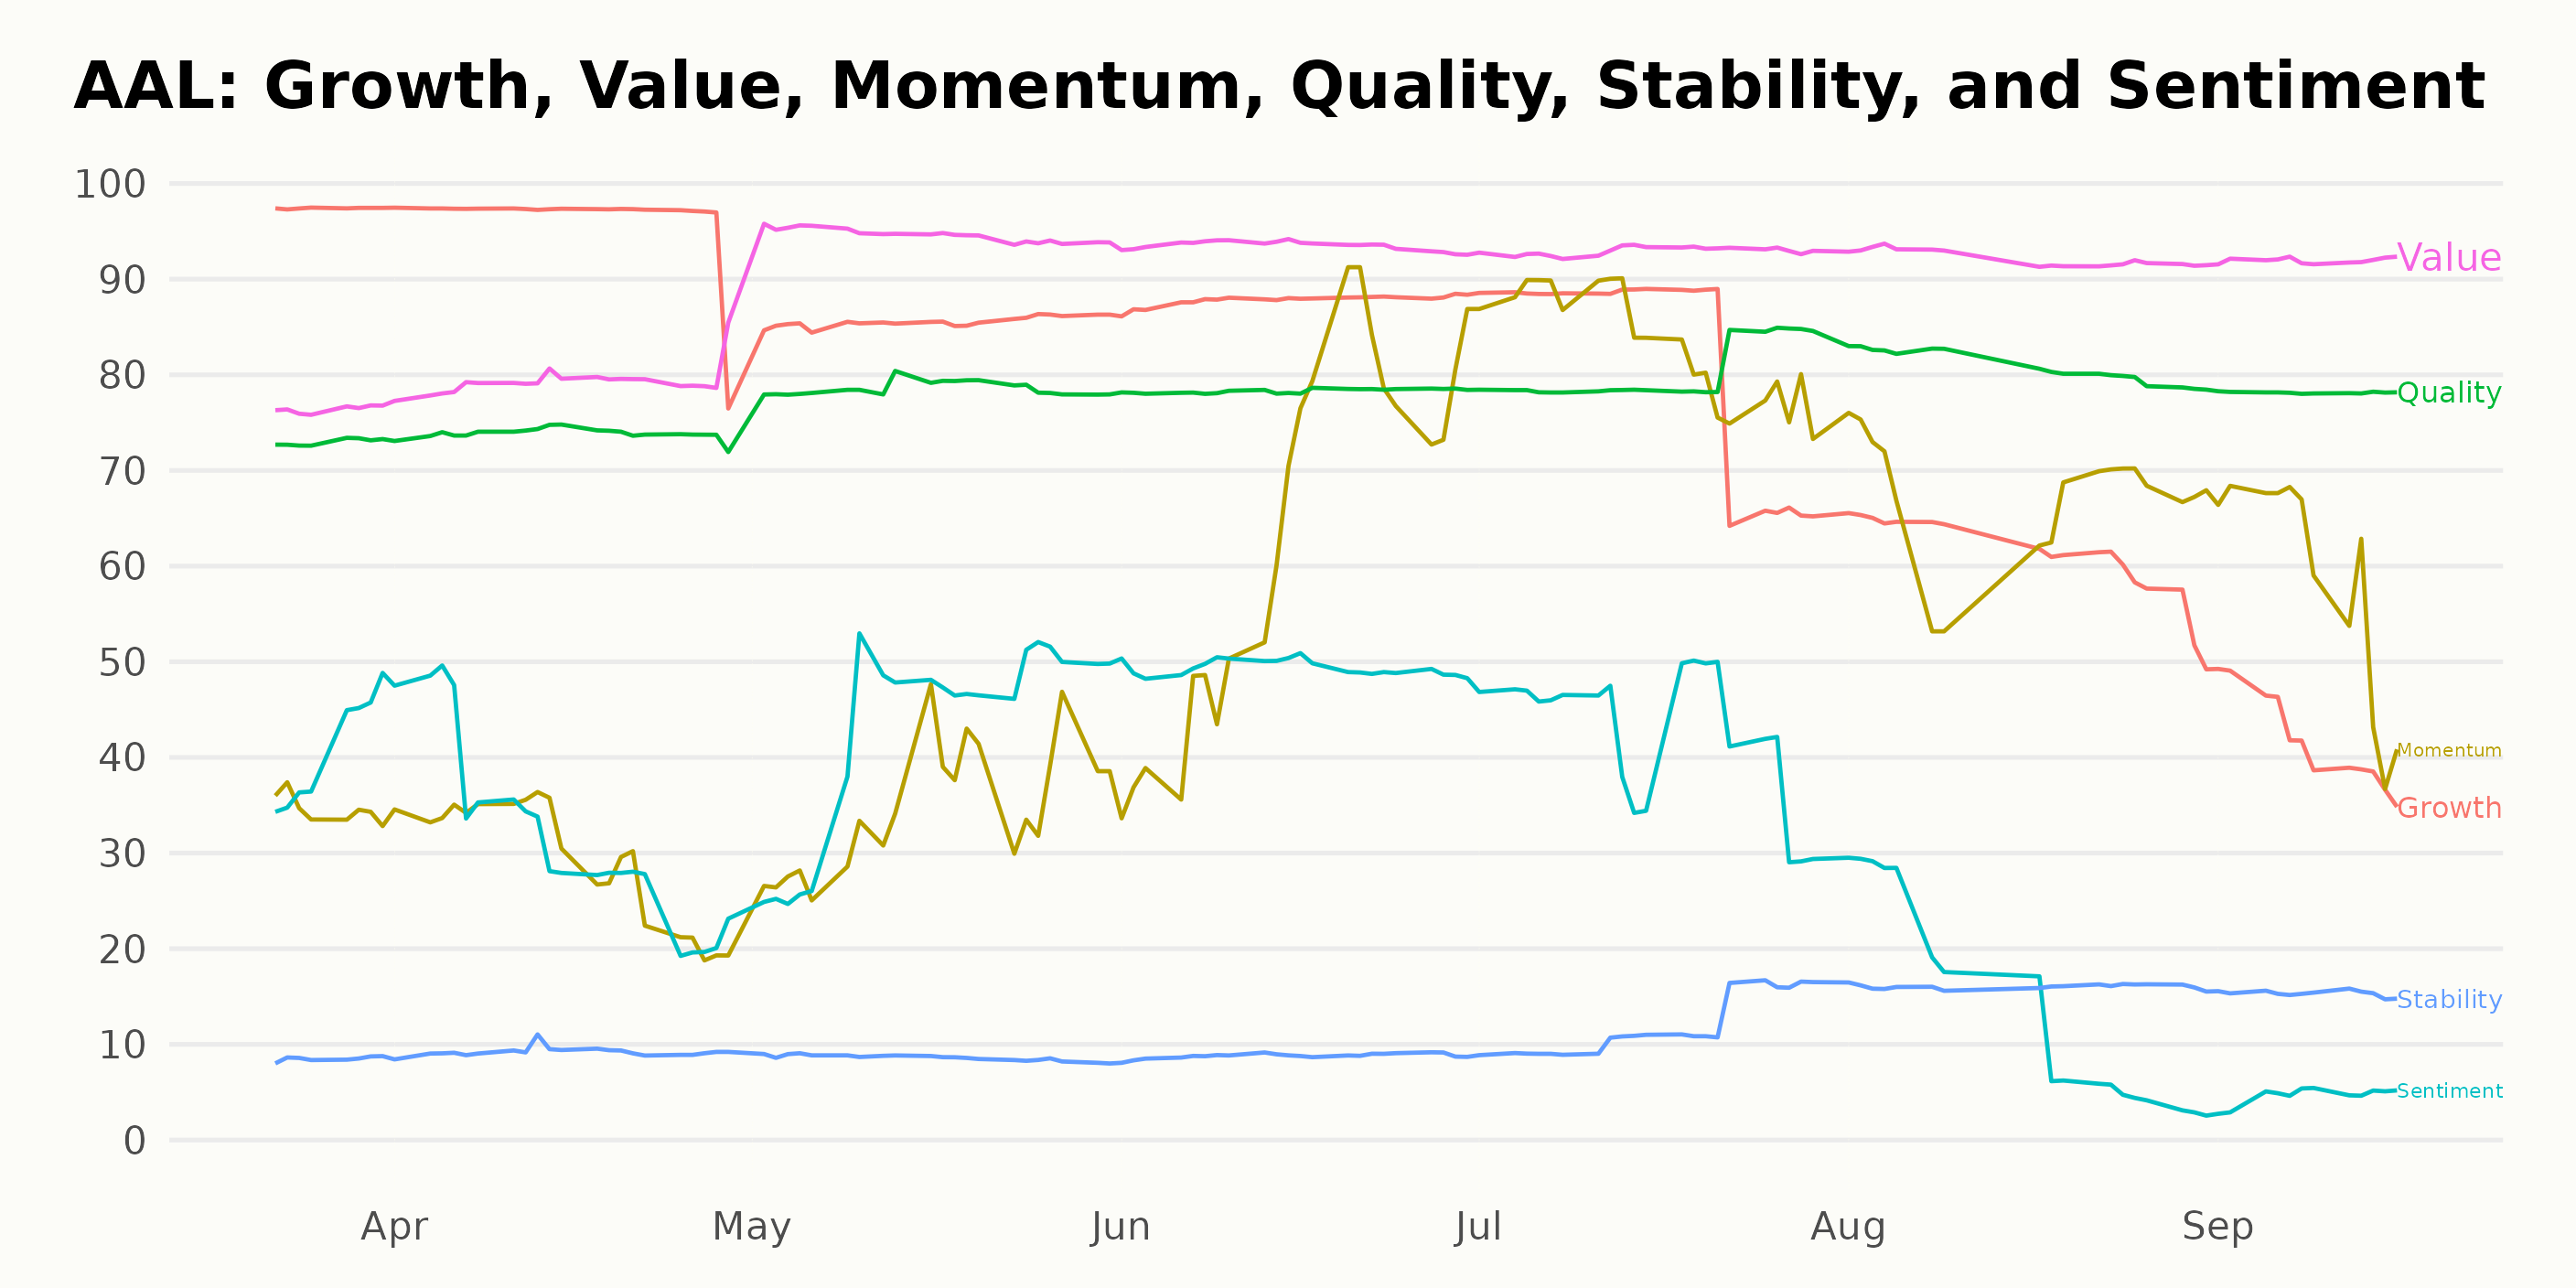
Analyzing American Airlines' Significant Growth, Quality, and Value Ratings for 2023
Based on the provided data, AAL's ranking and POWR Ratings grade have shown some fluctuations over the time period from March 2023 to September 2023.
- Between the weeks of March 25, 2023, and April 29, 2023, AAL maintained a steady POWR grade of C (Neutral) while its rank within the Airlines category fluctuated between #9 and #11 position.
- From May 6, 2023, to August 9, 2023, the company's POWR grade increased to B (Buy). Meanwhile, its ranking within the category varied from #6 (May 13, 2023) to #12 (August 9, 2023).
- In the week of August 19, 2023, AAL's ranking continued to decline, dropping to #13. This downward trend continued into the following week when it reached the #14 position in the Airlines category.
- On the week of September 2, 2023, the POWR grade of AAL decreased back to C (Neutral). Its rank further declined to #15 the same week but improved slightly to #14 in the following weeks.
As of the last available data point – as of September 18, 2023 - AAL is currently holding a POWR grade of C (Neutral), and its rank within the Airlines category of stocks is at #14 out of a total of 28 stocks.
According to the POWR Ratings, AAL's three most noteworthy dimensions are Growth, Quality, and Value.
Growth:
- In March 2023, AAL had a high growth rating of 97.
- The Growth rating experiences a downward trend with occasional spikes, dropping to 96 in April 2023, 86 in May 2023, and then rising to 88 in June 2023.
- Despite a decrease to 82 in July 2023, it continued its decline to 61 at the end of August 2023, ending at a low of 42 by mid-September 2023.
Quality:
- From a rating of 73 in March 2023, the Quality dimension progressively improves over time.
- It increased slightly to reach 74 in April, continued to 79 in May, and later reached 80 in July 2023.
- By the end of summer, in August 2023, the Quality rating peaks at 81, maintaining at 78 by mid-September 2023.
Value:
- AAL had a Value rating of 76 in March 2023.
- This Value dimension shows a clear ascending trend across the following months - 79 in April 2023 and peaking at 95 in May 2023.
- Though with slight decreases, it remains high with 94 in June, 93 in July, and 92 in both August and mid-September 2023.
In conclusion, while Growth shows a predominantly descending trend, both Quality and Value display increasing trends throughout the period observed for AAL.
How does American Airlines Group Inc. (AAL) Stack Up Against its Peers?
Other stocks in the Airlines sector that may be worth considering are Air France-KLM SA (AFLYY), Cathay Pacific Airways Limited (CPCAY), and Air Canada (ACDVF) - they have better POWR Ratings. Click here to explore more Airlines stocks.
43 Year Investment Pro Shares Top Picks
Steve Reitmeister is best known for his timely market outlooks & unique trading plans to stay on the right side of the market action. Click below to get his latest insights…
Steve Reitmeister’s Trading Plan & Top Picks >
AAL shares were trading at $13.18 per share on Monday afternoon, down $0.13 (-0.98%). Year-to-date, AAL has gained 3.62%, versus a 17.15% rise in the benchmark S&P 500 index during the same period.
About the Author: Anushka Dutta

Anushka is an analyst whose interest in understanding the impact of broader economic changes on financial markets motivated her to pursue a career in investment research.
The post American Airlines Group (AAL) – Buy Now or Wait for Clarity? appeared first on StockNews.com