
Off-price apparel and home fashion retailer The TJX Companies, Inc. (TJX) raised its full-year guidance for both pretax profit margin and EPS, following its higher-than-expected profit in the first quarter. For the fiscal year ending February 3, 2024, the company expects its pretax profit margin to range from 10.3% to 10.5% and EPS to be in the range of $3.49 to $3.58.
Furthermore, last month, TJX declared a quarterly dividend on its common stock of $0.33 per share, payable to shareholders on August 31, 2023. Its annual dividend of $1.33 yields 1.56% on prevailing prices. Its dividend payouts have grown at a 20.8% CAGR over the past three years and a 12.9% CAGR over the past five years.
Given this backdrop, is the stock a buy now? Let’s look at the trends of TJX’s key financial metrics to get an idea.
Examining TJX Companies Inc.’s Growth: Notable Increases in Revenue, Net Income, and Key Metrics from 2020 to 2023
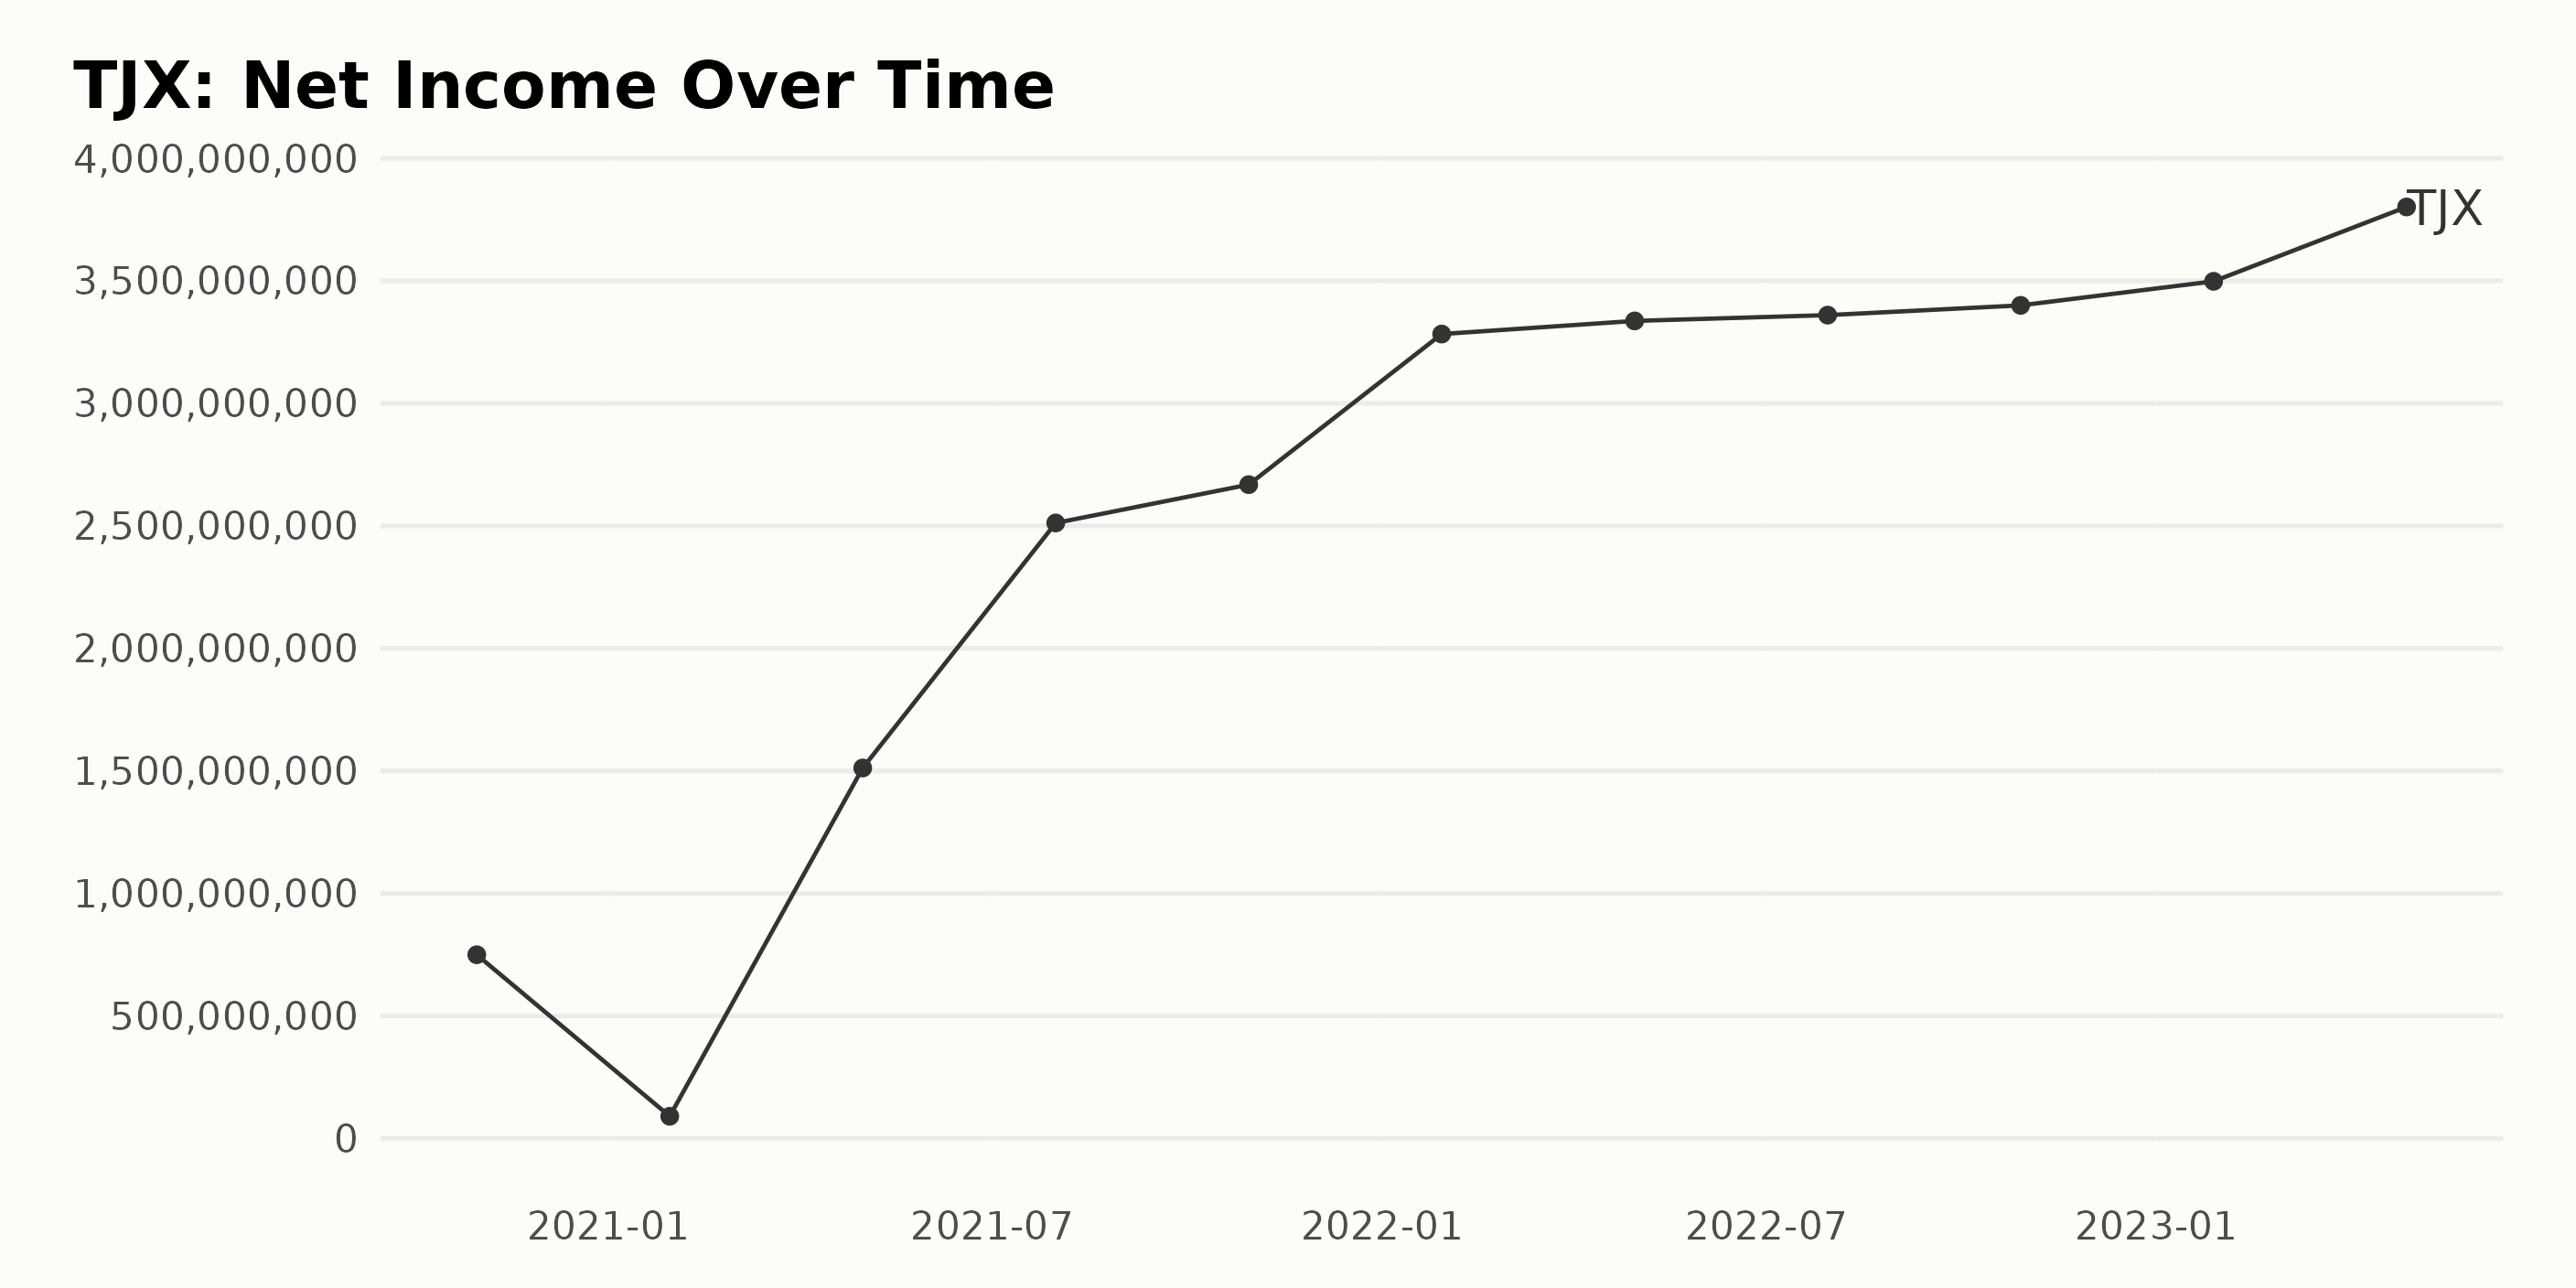
The trailing-12-month net income trend of TJX over the time period from October 2020 to April 2023 can be observed mainly as a steady increase.
- On October 31, 2020, the net income was $749.74 million.
- There was a notable dip in January 2021, where the net income fell to $90.47 million.
- A dramatic climb ensued in May 2021, with net income shooting up to $1.51 billion, suggesting a strong financial performance for the company during this period.
- The following uptrend persisted, reaching $2.66 billion by October 2021.
- As we moved into 2022, the numbers continued to rise to $3.28 billion in January, followed by a slight increase to $3.33 billion in April, reaching $3.36 billion by July.
- A subsequent increase in October 2022 marked the net income at $3.39 billion.
- The most recent data, as of April 2023, shows that the net income stands at an impressive $3.80 billion.
Calculating the growth rate from the first value in October 2020 ($749.37 million) to the last value in April 2023 ($3.80 billion) indicates a significant increase. Over this period, TJX’s net income has grown by over 400%. This data emphasizes the significant financial improvement and growth over the reviewed period.
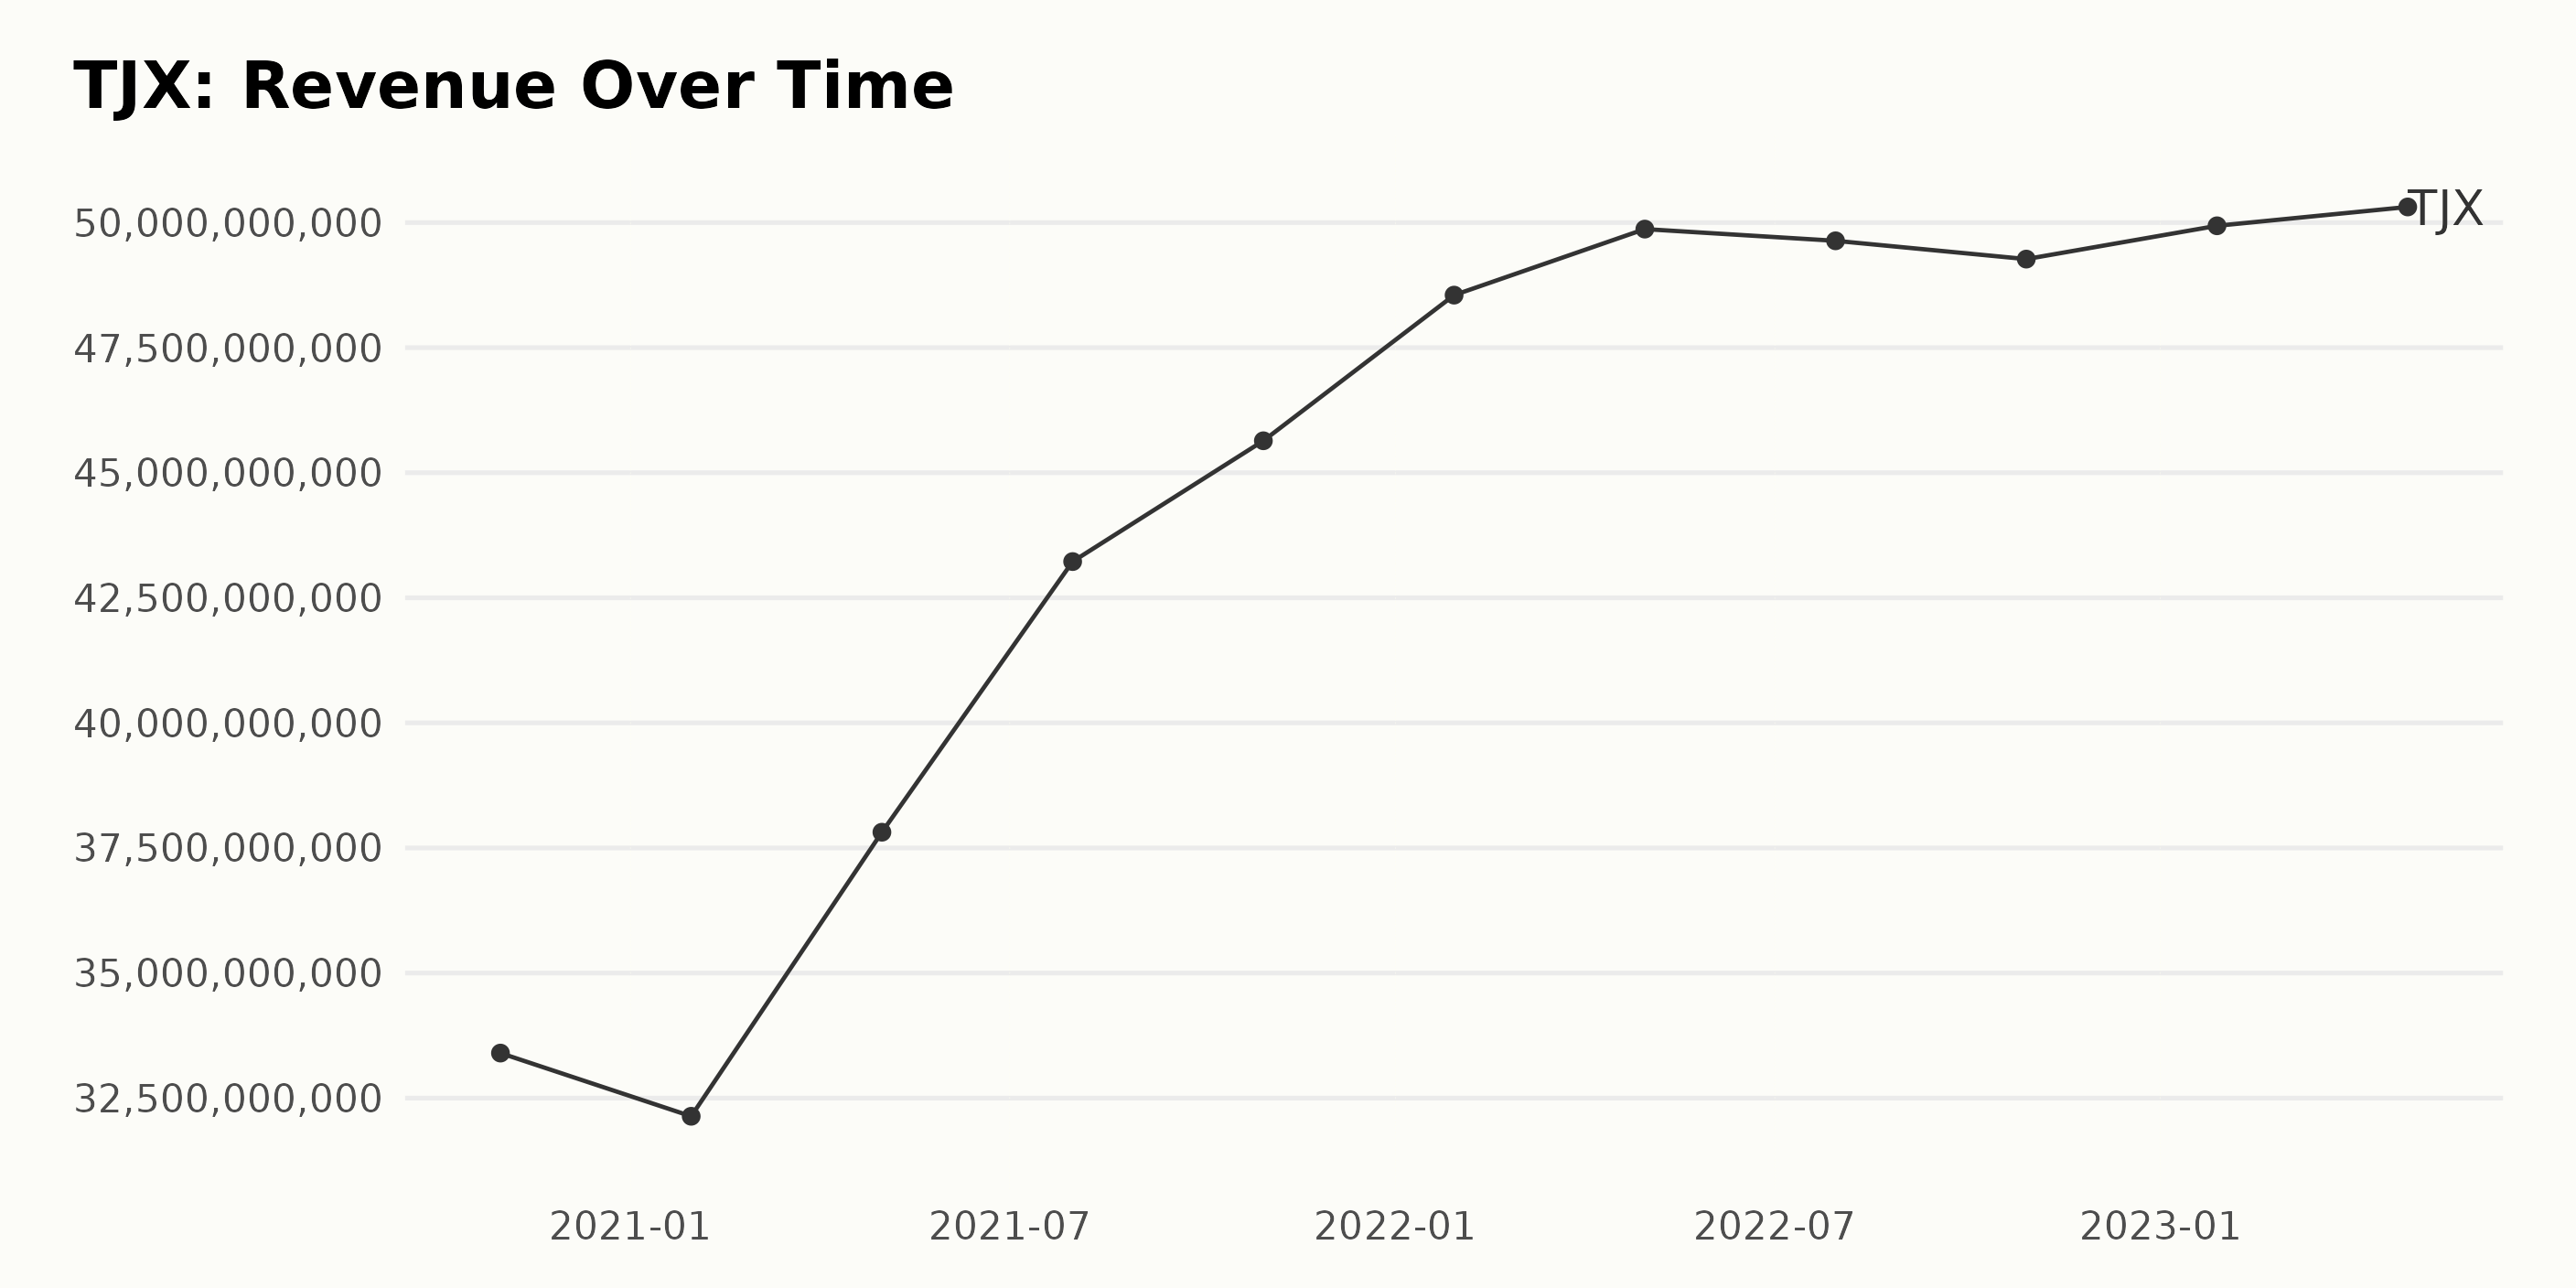
The trailing-12-month revenue of TJX has shown both an overall upward trend and some fluctuations throughout the given period. Here's a brief summary:
- As of October 2020, the revenue was around $33.40 billion.
- There was a moderate dip in revenue to approximately $32.14 billion by January 2021, marking a decrease from the previous value.
- Subsequently, the revenue significantly jumped to roughly $37.81 billion in May 2021 and continued upward throughout the year, reaching $48.55 billion in January 2022.
- Revenue of about $49.87 billion was reported by the end of April 2022.
- However, the following months saw a slight decline, with revenue dropping to around $49.67 billion in July 2022 and further to $49.27 billion in October 2022.
- At the start of 2023, revenue recovered to approximately $49.94 billion in January.
- The most recent figure for April 2023 shows a further increase to roughly $50.31 billion, establishing a new record height.
In conclusion, from October 2020 to April 2023, TJX recorded an overall increase in revenue. Despite some minor downturns, the overall trend signals robust growth. Specifically, the growth rate from the beginning to the end of this period is calculated to be approximately 50.30%.
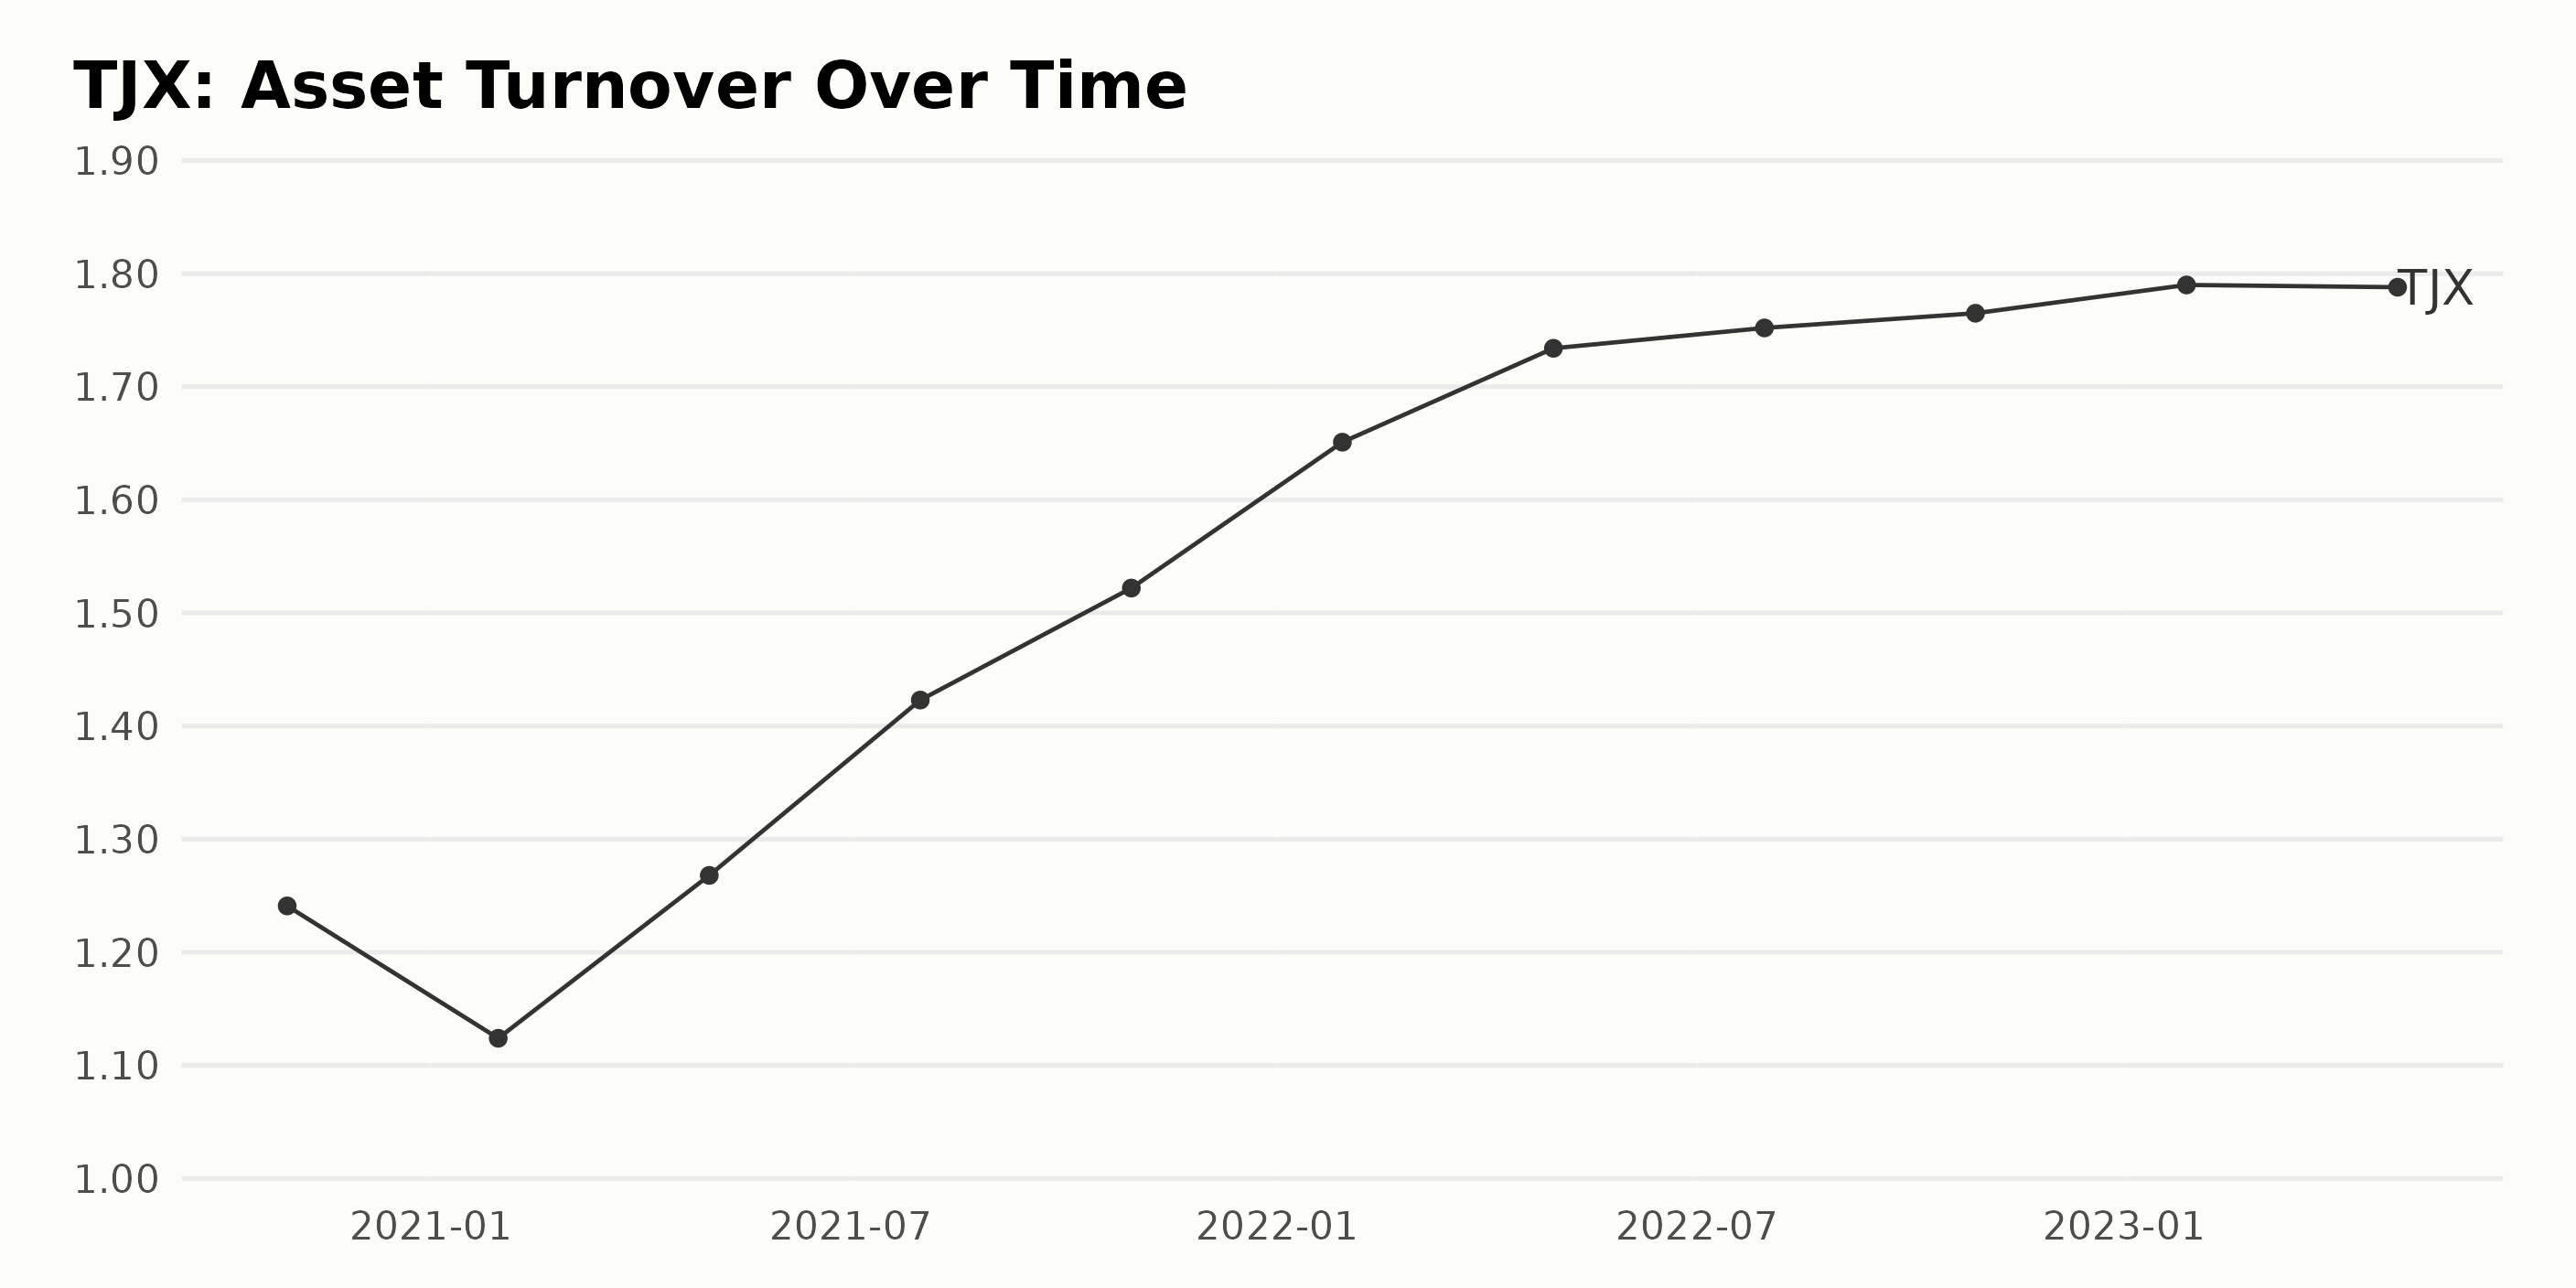
Looking at the data provided for TJX’s asset turnover:
- On October 31, 2020, the asset turnover was 1.24.
- There was a slight decrease by January 30, 2021, with the asset turnover coming down to 1.12.
- However, starting from May 1, 2021, there was a gradual upward trend. The value increased to 1.27 in May, went up further to reach 1.42 by July 31, and reached 1.52 by October 30, 2021.
- This growth trend continued well into 2022, with the asset turnover reaching 1.65 by January 29, 1.73 by April 30, and then slightly increasing to 1.75 by July 30.
- By October 29, 2022, the asset turnover showed a marginal increase to 1.77.
- The growth continued further into early 2023, peaking at 1.79 on January 28 of that year.
- The last recorded data point shows a slight dip, with the asset turnover dropping to 1.79 by April 29, 2023.
Across this period, TJX’s asset turnover shows a growth rate of approximately 44.08% from October 2020 to April 2023. It is seen that the trend has generally been fluctuating upwards, with the emphasis on later values showing more substantial growth. Yet, the recent slight fall in April 2023 offers a subtle hint to watch the trend for any potential declines closely.
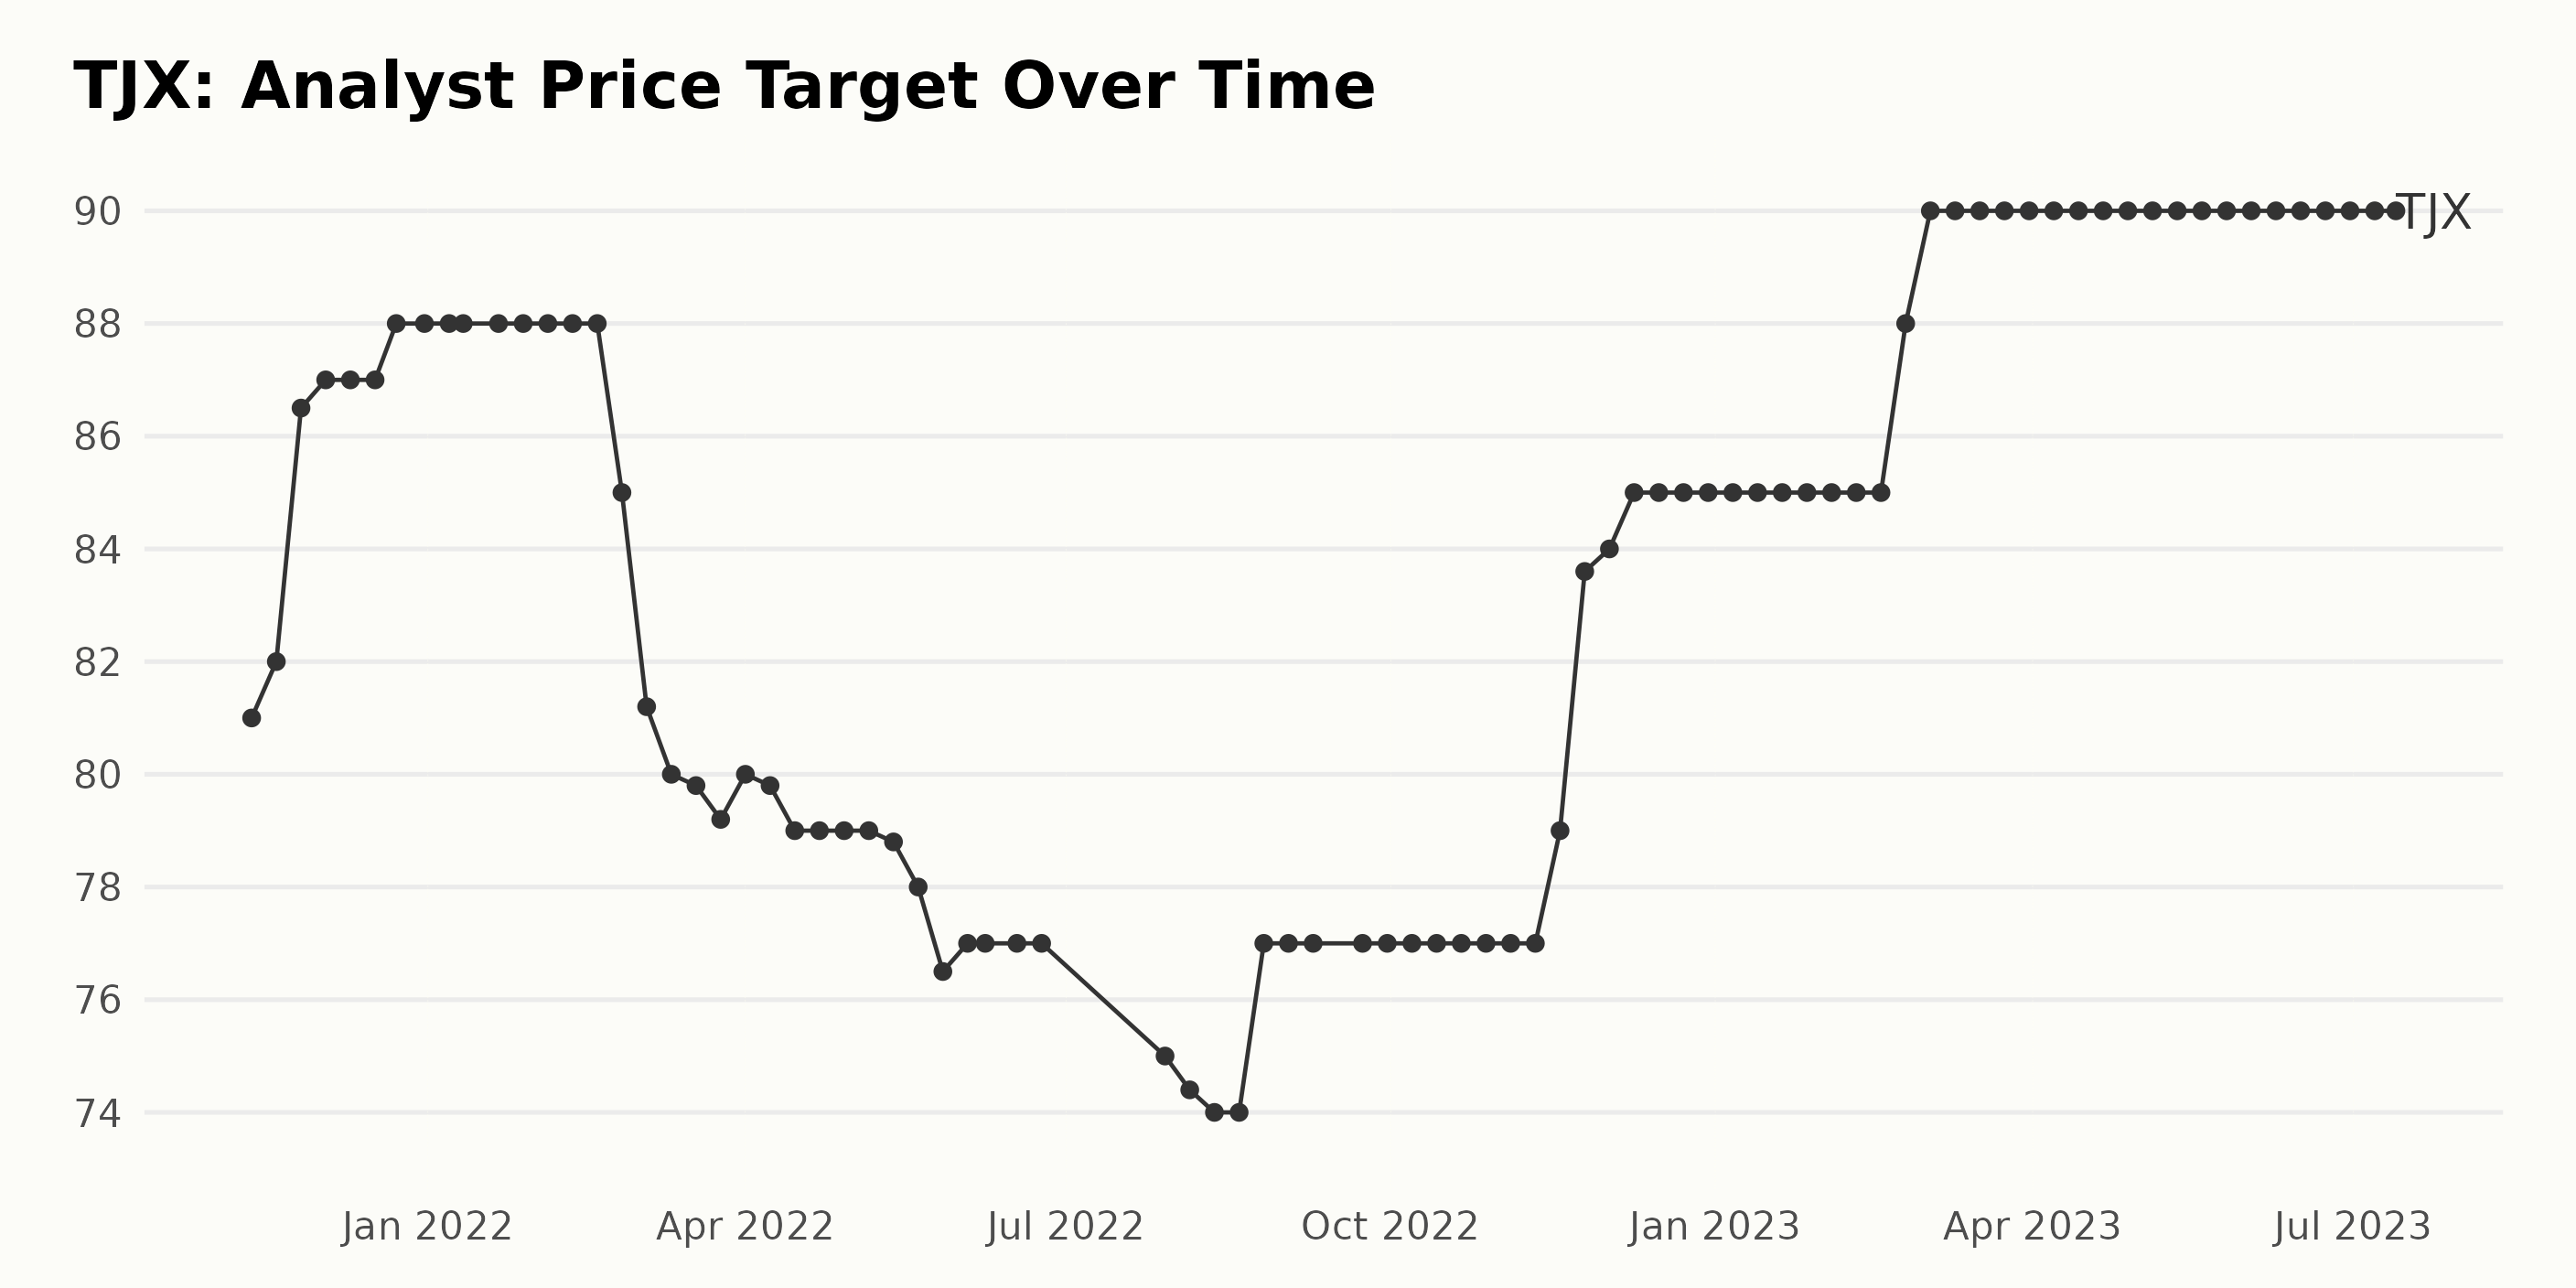
The analyst price target of TJX shows a fluctuating but overall positive trend over the period from November 2021 to July 2023.
- Starting at $81 in November 2021, it first rose relatively steadily, topping out at $88 by February 2022.
- This was followed by a period of decrease and volatility, with the target falling as low as $74.4 in August 2022 before climbing back to $77 by October 2022.
- There was a marked rise once again, hitting $85 by December 2022 and maintaining this level until February 2023.
- The final notable growth occurred from February to March 2023, where the target reached an all-time high of $90, sustained through July 2023, the end of this data series.
The growth rate over this period, comparing the first value of $81 from November 2021 to the last value of $90 in July 2023, is approximately an 11.11% increase. Despite the fluctuations and periods of decreased price targets, TJX's analyst price target shows a resilient upward trajectory overall.
Six-Month Journey of TJX Companies, Inc.’s Share Price: Fluctuations and Growth
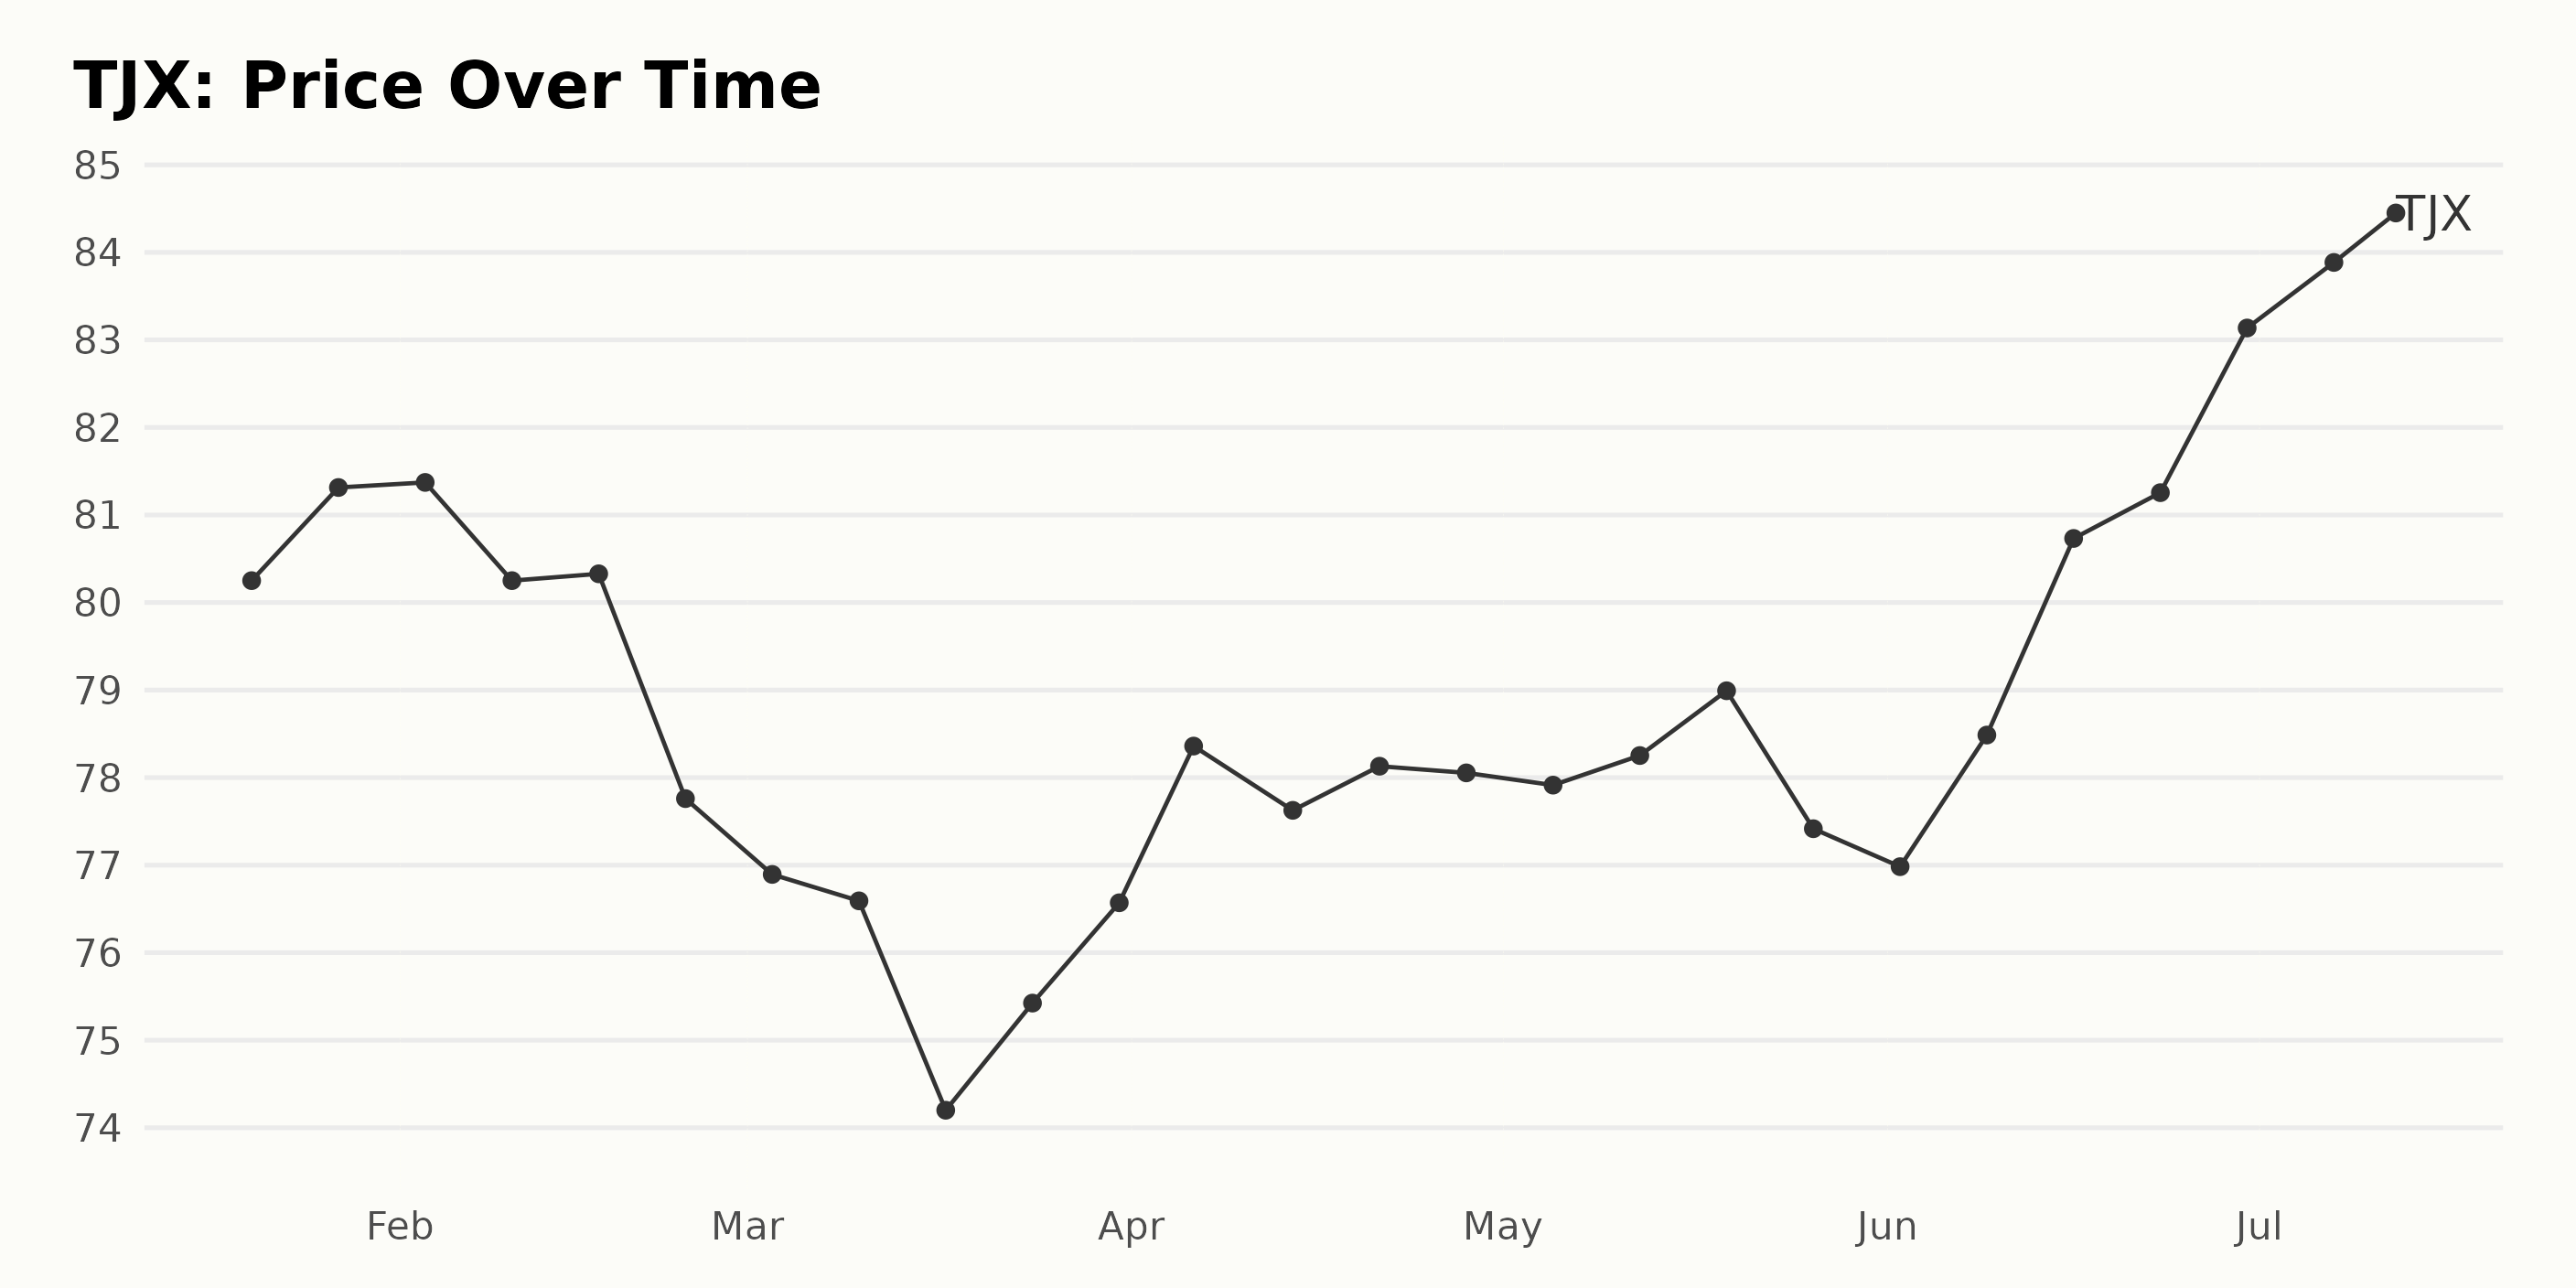
The data shows the share price of TJX over a six-month period from January to July 2023.
- On January 20, 2023, the price was $80.25.
- End of January 2023, on the 27th, there was a slight increase to $81.31.
- In February 2023, the price seemed to fluctuate around the $80 mark, concluding at $77.76 by February 24.
- March 2023 saw a decreasing trend at the beginning, going down to $74.2 by March 17 and concluding at an increased price of $76.57 by March 31.
- April 2023 witnessed a modest increase in the price, starting at $78.36 on April 6 and ending around the same value at $78.05 by April 28.
- The share price of TJX remained relatively stable through May 2023, ending slightly higher at $77.42 than it began at $77.91.
- During June 2023, the trend started to rise, and by June 30, the price had marked an increase reaching $83.14
- Finally, the price continued its positive trend in early July, closing at $85.25 on July 12.
Overall, the data reflects a fluctuating but generally increasing trend in the share price of TJX throughout these six months. There does not appear to be a clear, consistent growth rate as the price fluctuated frequently.
However, the most substantial increase appears to have been between late May and late June 2023, when the share price climbed from around $77 to over $83, indicating a positive growth acceleration during this period. Here is a chart of TJX's price over the past 180 days.
Tracing the Strong Quality, Growth, and Sentiment Ratings of TJX Companies, Inc.
The POWR Ratings grade of TJX in the Fashion & Luxury category, consisting of 66 stocks, has shown a clear progression over time.
- Starting the year 2023 off, from January to February, TJX held a consistent C (Neutral) POWR Grade. Correspondingly, its rank within its category varied between #17 and #21.
- A significant improvement occurred in TJX's ranking starting the week of February 25, 2023. The POWR grade jumped up to B (Buy), showcasing a better performance. The company's rank within the category dramatically improved, coming down to the second position.
- Throughout March to early July 2023, the POWR grade remains at a happy B (Buy). Despite some fluctuations, the rank within the category predominantly stayed within the top 10, mainly hovering around the #3 and #4 positions.
- As of July 13, 2023, the TJX stock still holds a B (Buy) POWR Grade, placing it firmly at the #6 rank in the Fashion & Luxury category.
This indicates that despite certain ups and downs, on the whole, TJX has consistently improved its position within the Fashion & Luxury category of stocks based on its POWR grade.
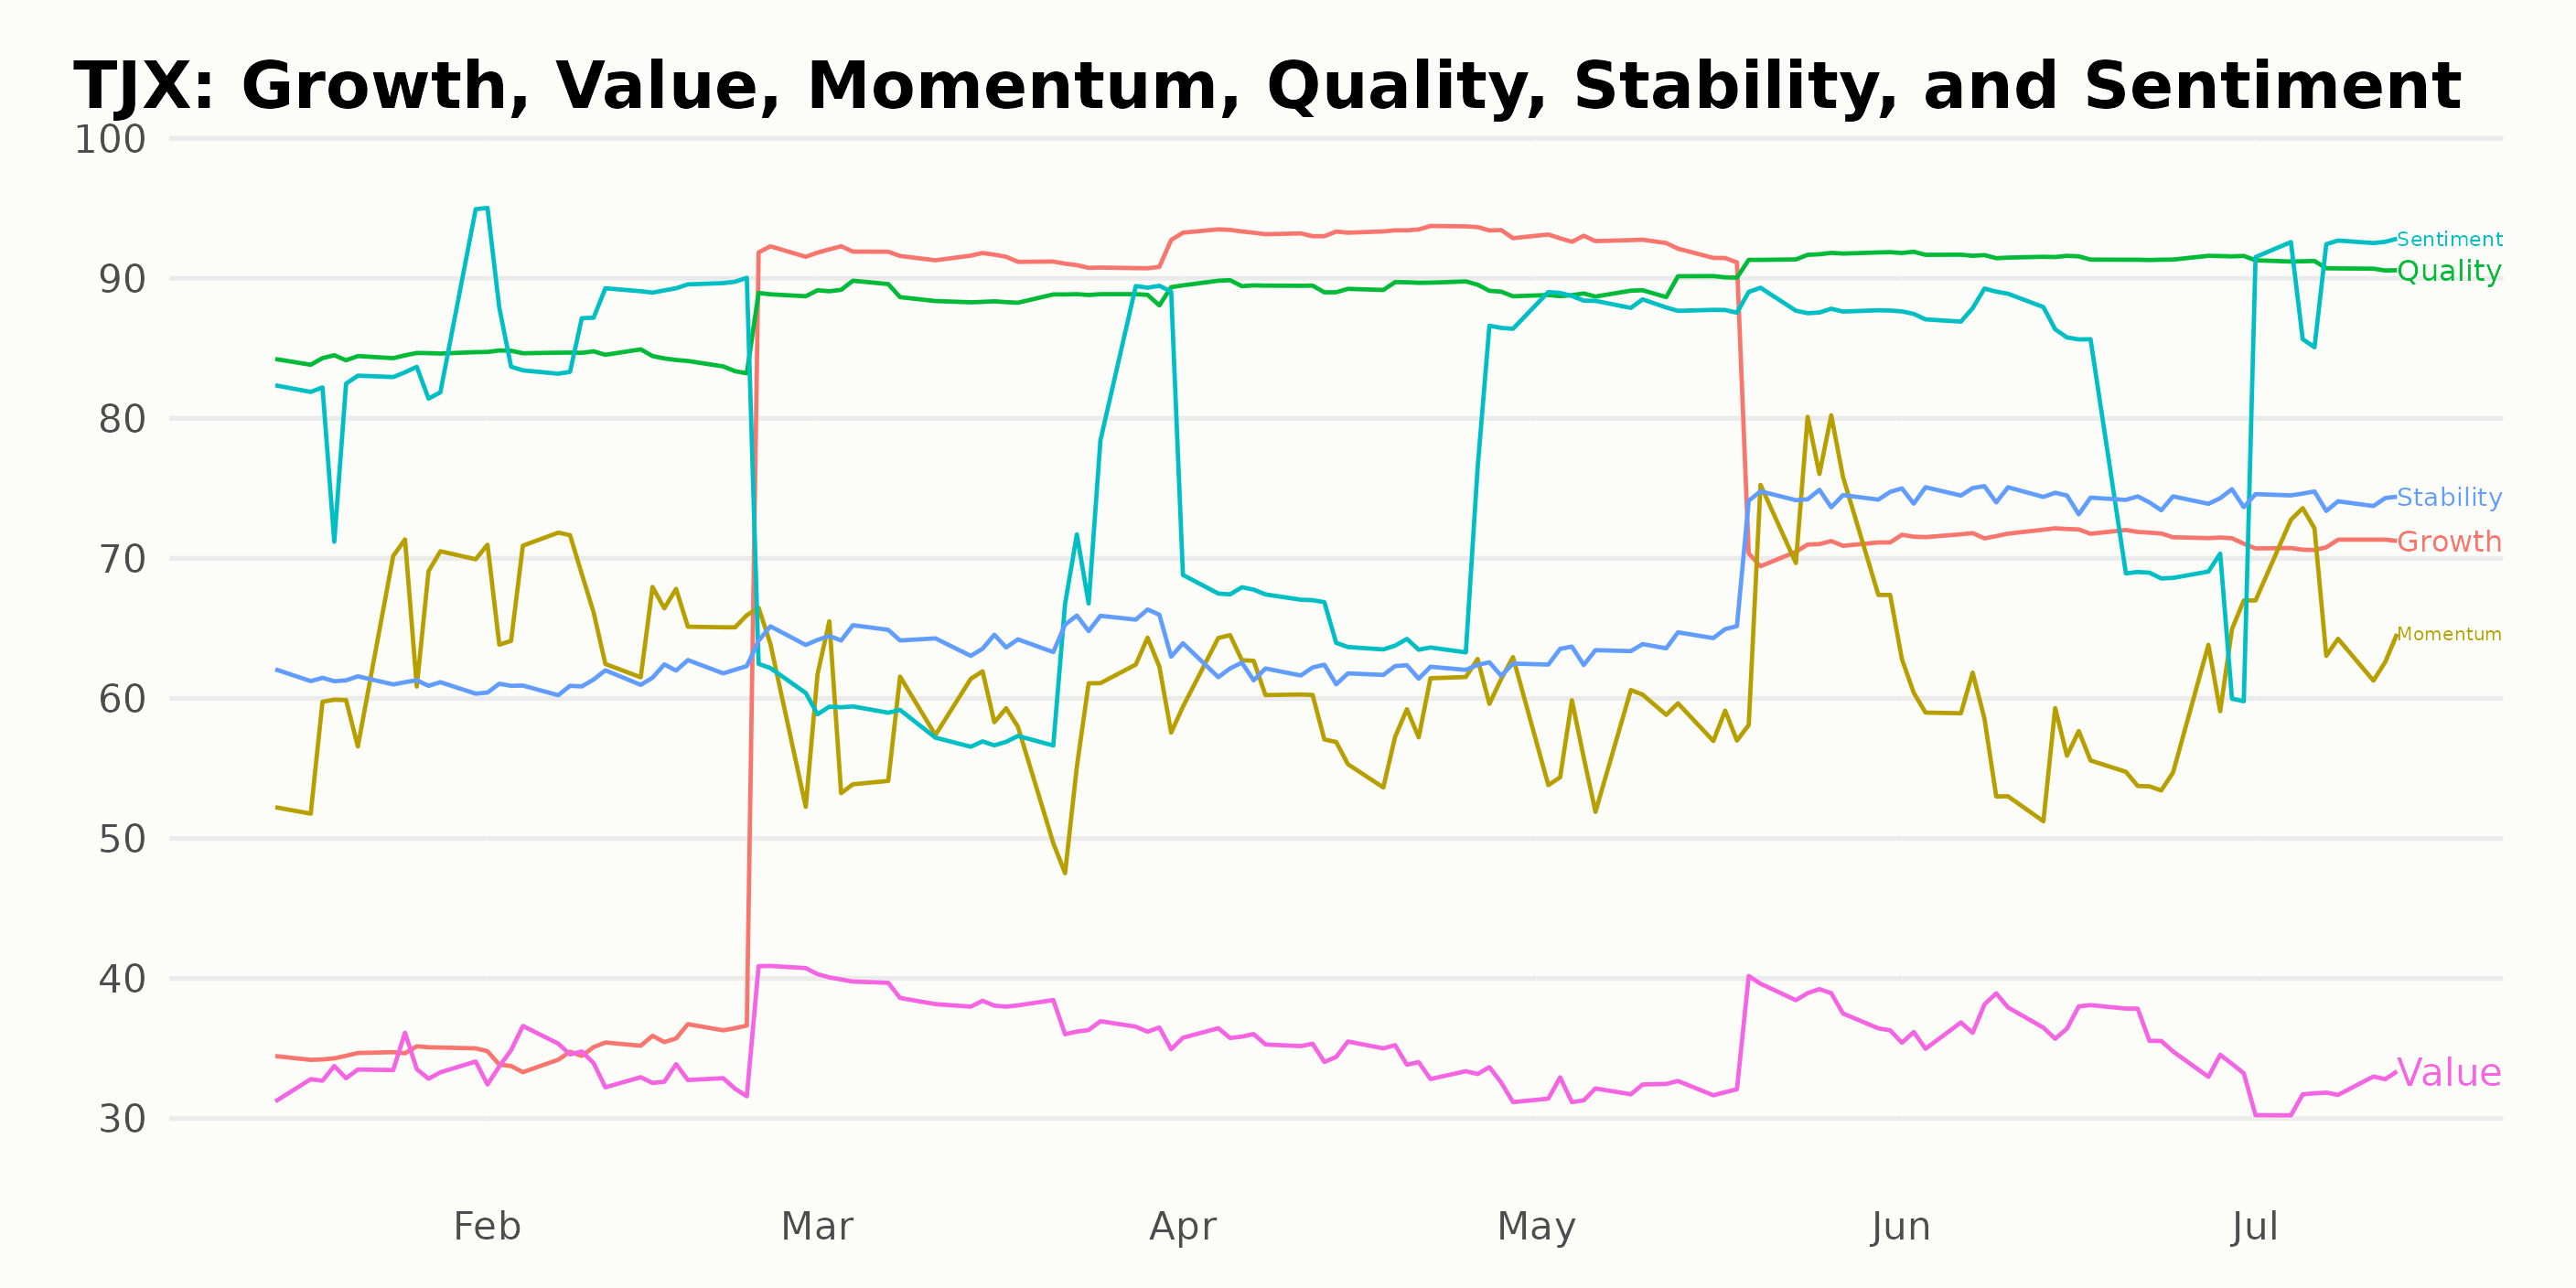
Analyzing the POWR Ratings of TJX, three dimensions are significantly noteworthy due to their high ratings and clear trends - Quality, Growth, and Sentiment.
Quality: Consistently, the Quality dimension has shown substantial ratings throughout the months. Starting from 84 in January 2023, there has been a gradual increase, reaching the highest score of 92 by June 2023. Even in July 2023, it managed to maintain a high value of 91. This consistent trend upholds Quality as one of the highest-rated dimensions throughout this period.
Growth: The Growth dimension has shown a significant upward trend from 35 in January 2023 to a peak rating of 93 by April 2023, showcasing an impressive improvement. From May 2023 onwards, there has been a slight decrease, but the overall ratings have remained relatively high, highlighting that Growth forms a vital part of TJX’s performance.
Sentiment: The Sentiment rating has generally fluctuated between the ranges of 66 (March 2023) and 91 (July 2023). While there were periods of slight fall, the overall trend has been upward. Especially in July 2023, with an incredibly high rating of 91, the momentum increased significantly, taking the Sentiment dimension to one of the highest spots for that period.
These three dimensions, Quality, Growth, and Sentiment, play a crucial role in TJX’s overall performance and clearly highlight the robust nature of the company.
How does The TJX Companies, Inc. (TJX) Stack Up Against its Peers?
Other stocks in the Fashion & Luxury sector that may be worth considering are J. Jill, Inc. (JILL), Weyco Group, Inc. (WEYS), and Chico's FAS, Inc. (CHS) – All of them have A (Strong Buy) or B (Buy) POWR Ratings.
What To Do Next?
Discover 10 widely held stocks that our proprietary model shows have tremendous downside potential. Please make sure none of these “death trap” stocks are lurking in your portfolio:
TJX shares were trading at $85.29 per share on Thursday afternoon, up $0.04 (+0.05%). Year-to-date, TJX has gained 8.00%, versus a 18.22% rise in the benchmark S&P 500 index during the same period.
About the Author: Anushka Dutta

Anushka is an analyst whose interest in understanding the impact of broader economic changes on financial markets motivated her to pursue a career in investment research.
The post Is TJX Cos. (TJX) Investors’ Newest 'Buy Now' Stock? appeared first on StockNews.com