 Photo From Exyte
Originally Posted On: https://exyte.com/blog/how-to-debug-apps-in-android-studio
Possessing a piece of hardware is not necessary to debug an application – Android Studio allows you to create virtual machines for debugging purposes. How to Debug Apps in Android Studio
What is debugging?Debugging is an essential step of the software development cycle, as it gives the developer a way to check the inner workings of the system and to trace the flow of data and instruction in the program. Unfortunately, many of the novice developers feel intimidated by the process and resort to non-optimal ways of debugging the app, or outright ignoring the bugs. To explain the main approaches of debugging and make your work more efficient, we’ll try to cover the most convenient tools in Android Studio.
Tools and software you would need for debuggingExcept for a program that you would be debugging, you would also need a computer with an Android Studio. Mind that possessing a piece of hardware is not necessary to debug an application – Android Studio allows you to create virtual machines and use them for debugging purposes. However, if you do choose to use a hardware device, such as a phone or a tablet, make sure to link it to the computer using a USB cable. It is also worth remembering that your app must have the “debuggable” tag set to True in the manifest file.
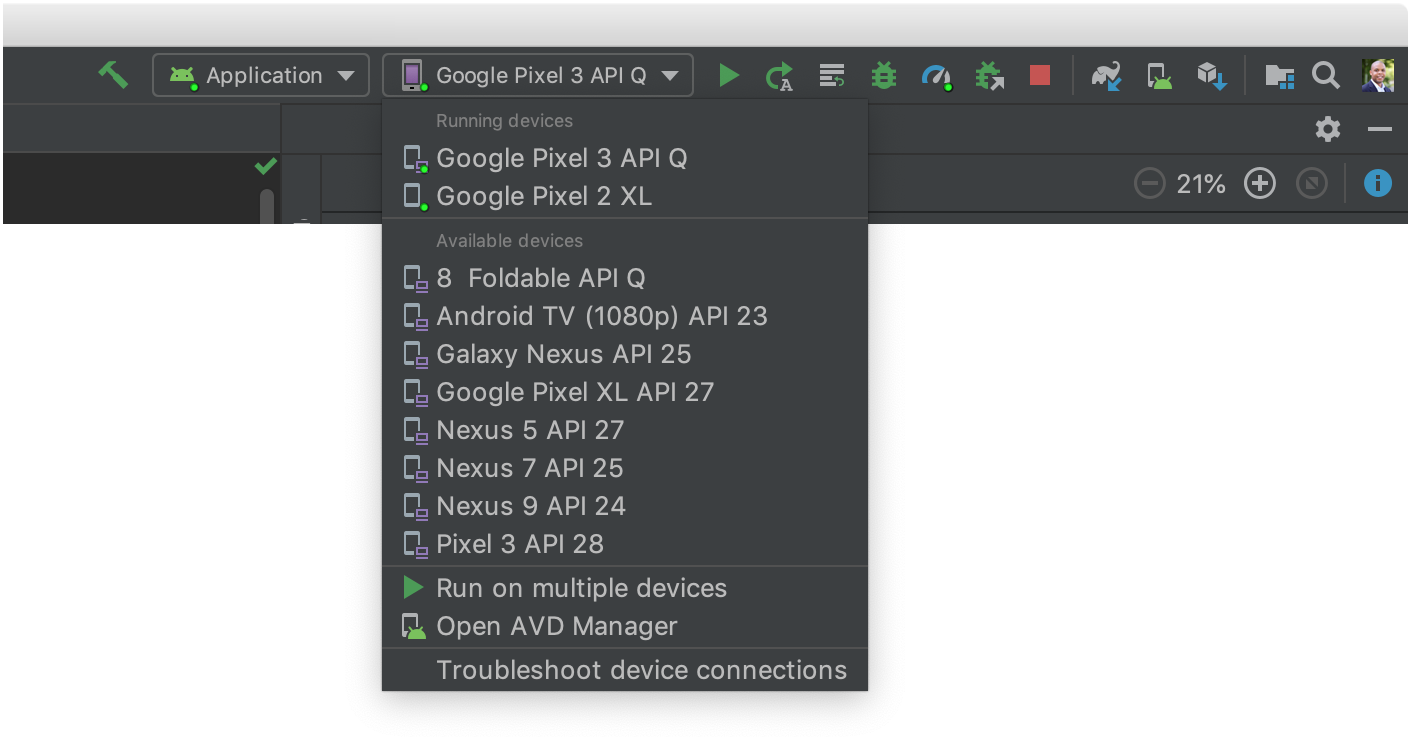
Engaging the debugging processDebugging your project on a linked device? Open your application and press Debug to engage the process. After you click this button, Android Studio will show a list of connected devices, including both hardware and simulated virtual machines. Select any one of the provided variants to engage the debugging process on this particular phone/tablet.
Source: developer.android.com
Those who can’t provide a required Android device can create an Android Virtual Device (AVD) for debugging and testing their apps. Creating an AVD is nothing complicated at all – just open “AVD Manager” in the Tools menu, and press the Create Virtual Device button. The SDK will then open a list of Android devices available for simulation, from which you can pick any one you need. Mind that you would need to choose a system image and download necessary libraries if your system is missing some of those. After the setup is finished, just proceed with opening the Debug mode.
Android Studio is designed to launch the Debug tool along with any app that you open in a respective mode. However, the tool itself is available at any time and can be accessed through clicking the Debug button.
Android Studio does not require developers to restart their apps to start debugging. In fact, you can attach the debugger to any application or process at any given moment. Why utilize this feature at all? Well, it’s a great option for those working with multiple processes simultaneously, as you can save the resources of your computer and your own time through debugging only particular parts of your app. Android Studio may significantly slow down your computer while you debug your apps, so attaching the debugger to those code pieces that really need it is quite a good strategy.
The role of logs in debuggingUpon finishing the initial setup, it’s a good idea to set up logging to track your app’s status and performance. And there is no better way to do it than using the Log utility. Engage it by using the android.util.Log command to have your Log outputs saved within Android Studio’s Logcat. Mind that the utility has different methods designed to indicate varying levels of verbosity. Each of those utilizes TAG and “your message” string parameters, while Throwable, the third parameter, can be passed alongside them to show you an exception log.
The methods that we have just discussed are extremely useful for debugging, as they provide you with a convenient way to sort out the reports in Logcat. These methods are designed to help developers clearly distinguish between the assigned verbosity levels. For instance, you can assign different colors to them to be able to grasp the essence of each Logcat report in seconds. If you are curious about which levels of verbosity exist, there are 5 of them, namely: Verbose, Debug, Info, Warning, and Error.
Speaking of the practical application of those methods, avoid compiling Verbose by all means if you are developing a release build! It should only be used while the application is being developed, because it can significantly affect the app’s performance. It’s also worth noting that the SDK in question saves Debug logs only during the app’s runtime and deletes them once you close Android Studio.
One the other hand, Warning, Error, and Info logs are never deleted and would remain in Logcat forever in case the developer doesn’t delete them manually. It is essential to remove them on time to avoid data leaks, especially in case any valuable information was logged. Other options for handling these logs include wrapping them into if-statements or creating a separate BuildConfig field within a Gradle file.
Explaining the Logcat UtilityAs mentioned earlier, Logcat is capable of handling if-statements. They are incredibly useful to distinguish between development and release builds. Consider the following example: let’s assume that we have created a property for configuring a build within build.gradle. Whenever we are running a debug build, we set it to True, and when we need a release build, we can turn it to false. This way, Logcat will be checking the property in question prior to showing any reports. What’s more, this approach works fine to cut the number of if-statements used to wrap Logcat messages.
Logcat also has an in-built feature of setting custom parameters for a given class. There are multiple parameters that can be assigned, most of them being aimed at making your work with Android Studio a bit more convenient. Mind that the number of parameters you can use is unlimited, which makes Logcat a very flexible tool.
Exploring breakpoints: what are they and how to use them?Breakpoints are an essential tool when it comes to Android development. To understand their capabilities, let’s consider the following example: you are debugging an application in Android Studio when something goes wrong and you receive a report. You return to the place where the mistake was found and carefully review it but can’t find why the problem has occurred. And this is where breakpoints become useful. They do a very simple yet very important thing – stop the execution of your app. In any place you consider needed or at any given line. Breakpoint support is one of the reasons why Android Studio provides such a great environment for debugging your apps.
So, how are breakpoints created? To add a breakpoint, you need to Locate the line of code where you want to pause execution, then either click the left gutter along that line of code or place the caret on the line and press the key combination to add a breakpoint (default is Control+F8 on PC and Command+F8 on Mac). A red dot on the sidebar should signalize us about the successful creation of a breakpoint. All that remains to test its capabilities is engage the debugging procedure.
Android Studio provides a very flexible solution with its breakpoints, as they can be adjusted and customized to fit the needs of developers. All the breakpoints are configured within the View Breakpoints window, where you can add, delete, or customize any one of them. For instance, separate breakpoints can be triggered by the activation of other breakpoints and remain inactive if certain conditions aren’t fulfilled. In addition, any breakpoint triggered immediately highlights the line of code where it is located.
Although Android Studio provides a truly decent solution with its breakpoints, they have their own drawbacks. Debugging with them is not as easy as it may seem since you will need to examine all variables within the Debug window manually through reading all your code. You can utilize Android Studio’s in-built tool to instantly transition to other breakpoints as well.
If you need to access some field values of an object, just expand its tree. Mind that for custom objects, this approach will result in the same output as using the toString() method. However, overriding the method is still required to access certain features, such as particular fields of an object. In this case, opening the tree is not needed since the results of your search will be shown right next to its root. For objects possessing a bitmap as a property, Android Studio creators have included the possibility to enjoy some images during debugging.
Android Studio allows you to determine watches, which are used to focus your attention on important variables. However, this does not limit you to only evaluating one variable; in fact, you are completely free to use almost any methods and objects from the app to evaluate an expression you are currently working on. In addition, Android Studio provides a dedicated Evaluate Expressions overview to explore the state of variables and objects in your app, including calling methods on those objects.
In-built recording features of Android StudioCapturing screenshots and short videos within Android Studio is very simple and convenient. This feature can be used in producing bug reports or as a promotion of your development skills. Make sure to use it carefully for avoiding data leaks!
The recording feature is accessible through an Android DDMS tool, where you should click the Screen Capture button to take a screenshot. Don’t forget to save it using a respective button! Mind that the explained method works only in the Debug mode, so you would need to launch it before recording the screen. A video capturing procedure is completely identical to taking screenshots, with the only difference being the button you need to press for starting the process (Screen Record).
