
 Photo from
Originally Posted On: https://buildops.com/resources/plumbing-company-growth-data/
How Business Growth Changed For Commercial Plumbing Companies In The Last 2 Years
Discover the difference field service software makes for successful company growth.
Introduction
ABOUT THIS GUIDE
Our research aimed to examine the employment number changes across commercial plumbing companies. We took data related to employee counts—and relative insights— from company LinkedIn profiles across the web. Our random sample contains a distribution of small, mid-size, and large companies—covering exactly 1760 businesses.
The analysis period includes time increments from the past six months, 11 months, and two years—the second part of the COVID pandemic and the end of the recovery period.
We condensed all of our findings into a single, easy-to-read summary—followed by three sections, each containing a detailed outline of all the data accumulated over each time period considered.
As a part of this study, we also took a sample of our own customer database in an effort to compare it against a random sample of commercial plumbing companies—where we don’t know if they employ any field service management software or not.
TOP FINDING
We discovered that the average company using the BuildOps platform grows 10% faster than a company that uses other software or no software at all (Based on employee growth numbers within a 2-year period – LinkedIn supplied data).
DATA SAMPLE
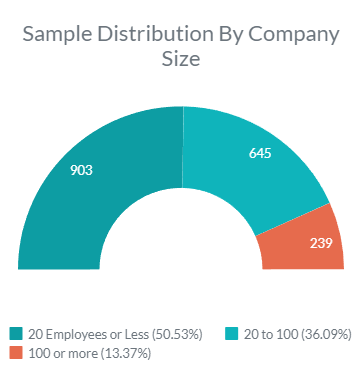
Our sample of 1760 commercial plumbing companies included 903 small businesses (20 employees or less), 645 midsize (20 to 100 employees), and 239 large companies (100 employees or more). The following image provides a visual representation of this distribution:
Find Out How Much Your Business Should be Saving in 2023. Get Your Personalized ROI Calculation Here

SUMMARY
We Combined ALL OF OUR FINDINGS IN SUMMARY FORMAT BELOW
In the total sample size of 1760 companies, six months ago, there were 903 companies with 20 employees or less. Let’s look at a two-year period, including the pandemic years. The number of companies in this group size decreased to 627, indicating that 34% of companies had expanded and left the small company segment (20 employees or less).
We have noticed that a relative number of companies have experienced a growth rate of 10-20% (roughly 690 or 39% of the total sample). Meanwhile, many companies have seen a modest 1% to 5% growth performance, increased 4.6x times over the past two years.
We are also seeing a 2x increase in companies that have experienced flat growth compared to two years ago, most of which are in the 20 employees or less company size group.
Companies experiencing a strong growth rate of 20% have gone down to only 10 (there were over 500 of them just 2 years ago).
The number of companies that have lost employees has varied from 12% to 14% over the past two years. The end of the pandemic presented both growth opportunities and volatility due to employees leaving or being let go. Comparing 6 months to two years ago reveals that there is more stability now, with fewer companies losing their workers.
The number of companies that have lost employees has varied from 12% to 15% over the past two years. The end of the pandemic era brought both growth opportunities and volatility due to employees leaving or having been let go. Comparing this six-month period to two years ago reveals that there is now more stability within the industry—with fewer companies losing their workforce.
Although 2021 still presented significant growth opportunities over these six months—particularly for small plumbing businesses—we have seen a steady decline in the growth probability for this particular group, from 48% two years ago to 24% over the past six months. Moreover, this approximate 2x decrease is visible across all midsize and small companies.
Companies with 20-100 employees and 100+ employees show very high growth potential, with midsize companies at 59% and large companies at 81%.

PLUMBING COMPANY GROWTH PAST 6 MONTHS
FINDINGS – 6 MONTHS
Over the last six months, 44.4%% of all plumbing companies we analyzed have experienced some level of growth. In contrast, 45% of companies experienced little to no growth at all. It’s important to note that, out of all the companies that experienced no growth, 595 (74%) were organizations with fewer than 20 employees.
Only 13% of the total sample experienced a loss of employees in the last six months.
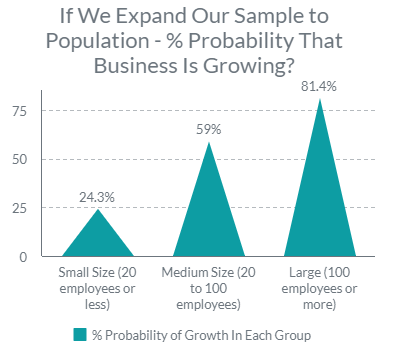
If we were to extrapolate these numbers to reflect the total number of commercial plumbing companies in the whole of the United States—what kind of growth potential would we see for each company size group in the last 6 months?
Growth potential based on company size:
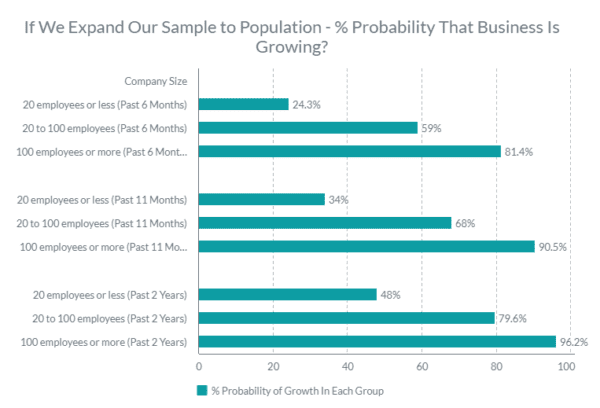
81.4% of businesses with 100 employees or more have seen growth in the past six months.
59% of companies with 20 to 100 employees have seen growth in the last six months.
24.3% of companies with fewer than 20 employees have seen growth in the past six months.
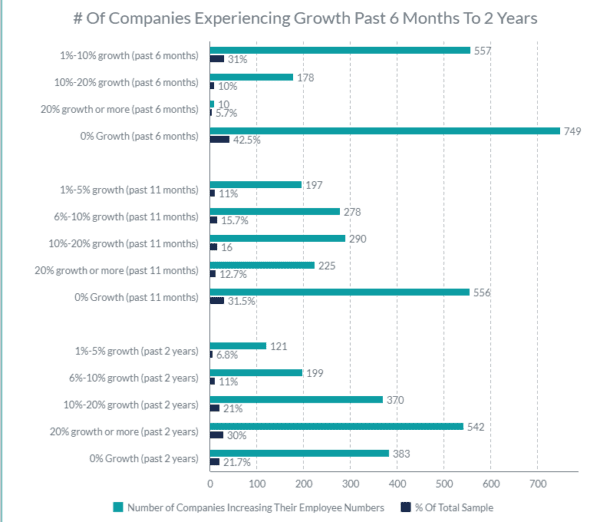
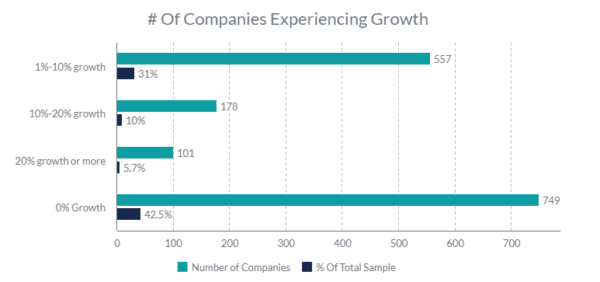
Over the last six months, 86.9% of businesses from our random sample size of 1760 experienced no loss of employees. 749 companies experienced 0% growth, 557 have seen between 1% and 10% growth, 178 companies experienced between 10% and 20%, and 101 companies experienced a whopping 20% + growth rate.
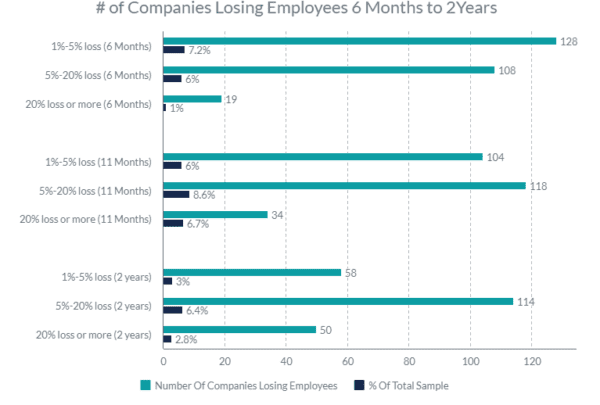
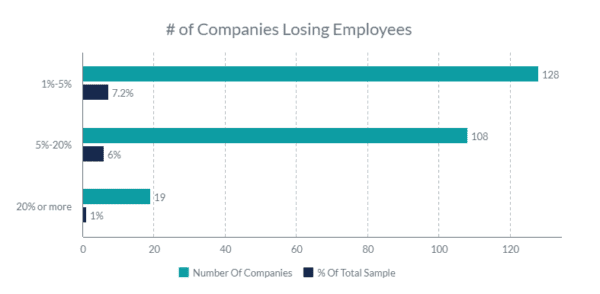
228 (13% of total sample) companies on our list have experienced a decrease in employee count in the past six months. 128 of these companies experienced up to a 5% employee loss over the same time period. 108 companies saw a 5-20% employee loss, while 19 companies experienced a loss of more than 20%.
Let’s take a closer look at which groups of companies lost or gained the most in the past six months.
100 + Employees:
We have 242 companies on the list with an employee count of 100 or more. Out of these, only 22 have experienced a reduction in employee count ranging from 1% to 6%, while 23 have seen no growth in the past six months. 145 companies have seen a 1-5% growth rate, and 51 have experienced a 6-20% growth rate.
This means that 81.4% of large companies with 100 employees or more have been experiencing growth over the past six months, with 60% of these companies growing at a modest pace of 1-5% over the same time period.
20 to 100 Employees:
If we take a look at the midsize group, with 100-20 employees, we find 645 companies. 75 of these have seen no growth in the past six months, 380 have experienced positive growth, and 126 have seen a decrease in employees. 308 of these companies have seen growth from 1-10%, and 91 have experienced growth of 10-50%.
20 Employees Or Less:
Roughly 65% of the companies in the sample (1-20 employees) that were noticed on LinkedIn did not experience any growth in the past six months, and 88 experienced a negative growth rate. However, 220 of these companies experienced positive growth—72 of which with a 1%-10% increase in their headcount. In this small enterprise group, roughly 16% experienced significant growth of 10-50%, with a few surpassing even that.
PLUMBING COMPANIES GROWTH PAST 11 MONTHS
FINDINGS – 11 MONTHS
Of the companies that we looked at, 53.8% experienced growth in the past 11 months. 31.5% had 0% growth, with most of these companies being businesses with fewer than 20 employees.
Only 14.5% of the total sample size have lost employees in the past 11 months, with the majority of those being from the small business category (1-20 employees).
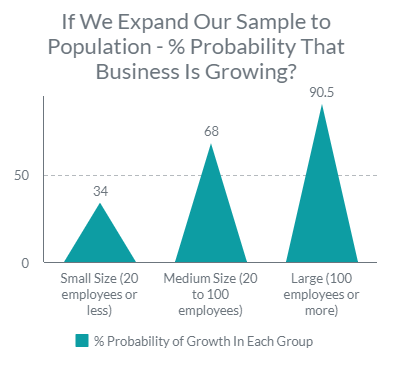
If we were to extrapolate these numbers to reflect the total number of commercial plumbing companies in the whole of the United States—what kind of growth potential would we see for each company size group in the last 11 months?
Growth potential based on company size:
90.5% of businesses with 100 employees or more will have seen growth in the past 11 months.
68% of businesses with 20 to 100 employees will have seen growth in the past 11 months.
Only 34% of businesses with 20 or fewer employees will have seen growth in the past 11 months.
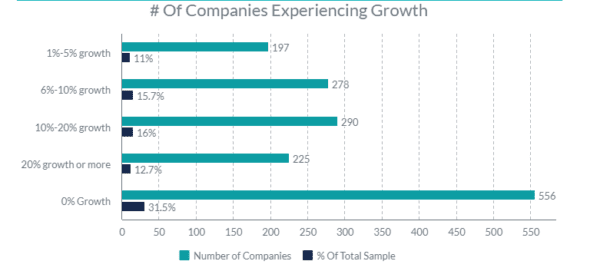
Over the past 11 months, 556 of the 1760 companies sampled experienced 0% growth, while 197 saw a growth rate of 1%-5%. An additional 278 companies experienced a growth rate of 6 to 10%, and 290 companies had a growth rate of 10%-20%. The most impressive growth was seen by the 225 companies who experienced a growth rate of 20% or more. Altogether, 85.3% of the companies on the list had no decrease in their employee count.
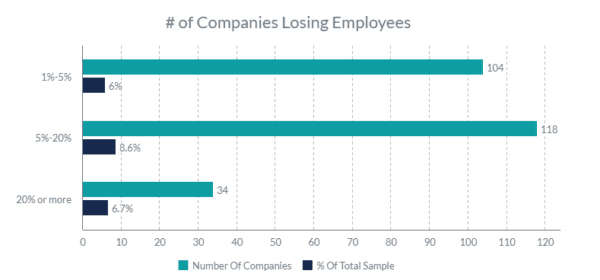
In the past 11 months, 256 companies on our list have experienced a reduction in employee headcount. 104 of these companies experienced a 1-5% employee loss, while 118 experienced a loss of 5%-20%. The most significant reduction was seen by the 34 companies who experienced an employee loss of above 20%.
Let’s take a closer look at which segments lost or gained the most in the past 11 months.
100 + Employees:
Of the 242 large companies on the list with 100 or more employees, 15 experienced a reduction in employee count ranging from 1% to 7%. Seven companies experienced 0% growth in the past 11 months, while 69 had a growth rate of 1% to 5%. The remaining 151 companies had a growth rate of 6% to 62%.
Altogether, 91% of the large companies with 100 employees or more have experienced growth in the past 11 months.
20 to 100 Employees:
If we look at the midsize segment, including businesses with 100 to 20 employees, there are 645 companies. 83 of these companies experienced 0% growth in the past 11 months, while 439 had positive growth and 124 lost employees. 254 companies here experienced growth from 1% to 10%, 159 had a growth rate of 10% to 25%, and 45 had an employee growth rate above 25%.
20 Employees Or Less:
The small company segment (51% of the data sample), consisting of businesses with 1 to 20 employees, made up more than half of the total sample size. 472 of these companies experienced no growth in the past 11 months, and 98 experienced negative growth. 307 experienced growth, with 62 companies having a 1%-10% increase in headcount. Roughly 245 (14% of the total sample) of these smaller businesses are experiencing significant growth of 10% or more.
PLUMBING COMPANY GROWTH PAST 2 YEARS
FINDINGS – PAST 2 YEARS
Of all the plumbing companies that we looked at, 65% have experienced growth in the past 2 years. 21.7% had 0% growth; this was most prevalent amongst companies with less than 20 employees.
Only 12.6% of the companies sampled have experienced a loss of employees in the past 2 years.
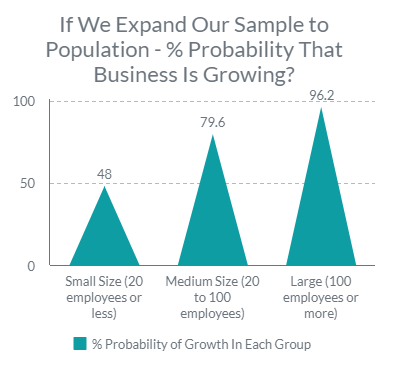
If we were to extrapolate these numbers to reflect the total number of commercial plumbing companies in the whole of the United States—what kind of growth potential would we see for each company size group in the last 2 years?
Growth potential based on company size:
96.2% of companies with 100 employees or more would have seen growth in the past 2 years.
Roughly 79.6% of companies with 20 to 100 employees would have seen growth in the past 2 years.
Only 48% of companies with fewer than 20 employees saw growth in the past 2 years.
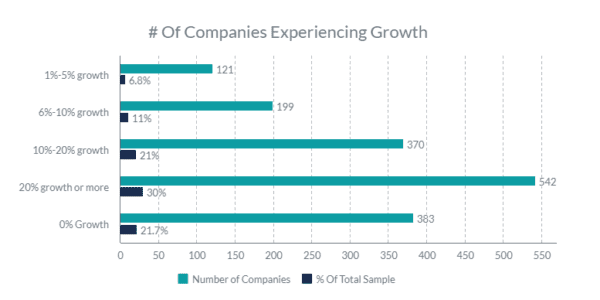
Over the last two years, 87% of the 1000 companies sampled have not experienced a decrease in employee count. Of those companies, 383 experienced no growth, 121 saw a growth rate of between 1-5%, 199 had a 6-10% growth, 370 experienced 10-20% growth, and 542 had an impressive growth rate of 20% or more.
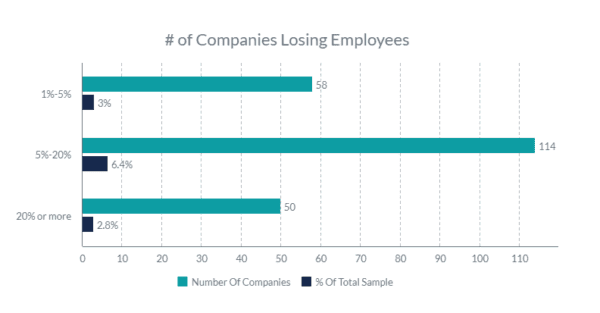
222 of the companies on our list have seen a decline in the number of employees over the last two years. 58 of these companies had a drop of between 1-5%, 114 had reductions of between 5-20%, and 50 had losses of over 20%.
Let’s take a closer look at which segments lost or gained the most in the past 2 years.
100 + Employees:
Of the 242 companies on the list with 100 or more employees, only 7 have seen a decrease in their employee count by 1-8%. Conversely, two companies have experienced no growth, 34 have seen a growth rate of 1-5%, and 199 have seen a growth rate of 6-100% or more.
This means that 96% of large companies (100 employees or more) are experiencing growth over the last two years.
20 to 100 Employees:
In the midsize segment, with 100-20 employees, there were a total of 645 companies. 38 of them saw no growth in the last two years, 514 had positive growth, and 93 lost employees. 336 companies had a growth rate of 1-10%, 201 had a growth rate of 10-25%, and 146 had a growth rate of over 25%.
20 Employees Or Less:
In the small business segment (1-20 employees), which makes up more than half of the total sample size, 345 companies saw no growth in the last two years, while 125 had negative growth. 433 experienced growth. Of these 287, 60 had experienced growth up to 10%, and 373 had a growth rate of more than 10%.
ABOUT BUILDOPS
BuildOps is an all-in-one cloud-based software solution that empowers commercial HVAC, plumbing, electrical, and mechanical contractors to efficiently and effectively manage operations and field service on a single platform while maximizing efficiency and driving profitability. Founded in 2018, BuildOps has gone on to transform the lives of commercial contractors across the industry.
- Faster quoting and invoicing can bump revenue by up to 50%
- Every part of your business managed in one platform
- Higher technician productivity results in more jobs
- Standardized workflows to increase efficiency and data accuracy
- Easy and accurate asset and equipment management
- Seamless management of preventative service agreements
- Intuitive project management allows for additional pull-through work


