

Halliburton Co.(NYSE: HAL) is one of the world’s largest oilfield services companies offering various service solutions addressing the oilfield lifecycle. The company primarily operates two core segments. Its Drilling & Evaluation (D&E) segment focuses on the drilling phase by providing drilling services, equipment, and consulting services.
Its Completion & Production (C&P) segment focuses on the production phases offering services like hydraulic fracturing, well intervention and production enhancement services to optimize production while recovering hydrocarbons from the reservoir.
Recent oil production cuts by OPEC could fuel greater demand for Halliburton’s services and improve margins for refineries and service providers. Its competitors include the largest global oilfield services company Schlumberger (NYSE: SLB), Baker Hughes Co. (NASDAQ: BKR) and Weatherford International plc (NASDAQ: WFRD). The company experienced margin expansion in both divisions as revenues rose double digits for the full-year 2022.
Surprise OPEC Production Cut
The markets were surprised over the weekend of April 2, 2023. This caused crude oil prices to surge over $5 a barrel. Saudi Arabia announced it would cut production by 500,000 barrels a day. Russia made a 500,000-barrel-per-day cut until the end of the year. A total of 1.6 million barrels per day were cut.
The cut in oil production will raise energy prices which are key drives of inflation. This triggered more fears of deeper and or longer Fed interest rate hikes. The White House was concerned and stated that it wasn't advisable to cut now as central banks attempt to bring down inflation.
Printing Profits
On Jan. 24, 2023, Halliburton released its fiscal Q4 2022 results for the quarter ending in December 2022. The company reported an earnings per share (EPS) profit of $0.72, excluding non-recurring items, beating consensus analyst estimates of $0.67 by $0.05. Revenues grew 30.5% year-over-year (YoY) to $5.58 billion versus $5.59 billion consensus analyst estimates.
A Good Year Expected to Get Better
Full-year 2022 revenues were $20.3 billion, up $5 billion or 33% YoY. Operating income was $2.7 billion, and adjusted operating income was $3.1 billion for the fiscal full-year 2022, excluding impairments and other charges. North American revenues grew 51% YoY as pricing gains improved margins. Both segments of D&E and C&P had revenue growth. D&E margins improved by 320 bps to 15%. C&P margins improve 290 bps YoY to 18%, driven by pricing improvements and higher volumes.
Nonproductive time was improved by more than 7% YoY resulting in the highest uptime in its history. The company maintained capital spending of 5% to 6% of total revenues. It retired $1.2 billion of debt and ended the year with $2.3 billion in cash and cash equivalents.
CEO Insights
Haliburton CEO Jeff Miller commented, “Halliburton's execution in 2022 demonstrated the earnings power of our strategy, and I expect this power to strengthen in 2023 and beyond. Both operating divisions delivered strong margins in the international and North American markets.” The board increased its dividend to $0.16 per share.
CEO Miller continues to see oil and gas "tightness." Activity grew 30% as spending grew 50% in the U.S. to yield a 5% production increase. He expects supply-side challenges to continue through 2023. Despite central banks raising interest rates, oil and gas demand will remain strong. China's re-opening will lead to further demand increase in 2023.
Benchmark Initiated Coverage with a Buy Rating
On April 3, 2023, Benchmark Co. initiated coverage of Halliburton stock with a Buy rating and a 50 price target. It noted that shares need to catch up to its business mix. Analyst Kurt Hallead commented that HAL shares have "substantially" underperformed its earnings, business mix, and peer group in a "classic case of guilty until proven innocent".
Weekly Rectangle Range
The weekly candlestick chart for HAL illustrates a year-long rectangle range between the $41.98 upper trendline and the $23.12 lower trendline. There are two weekly market structure low (MSL) triggers at $30.88 and $39.06. Shares bounced from the low of $23.12 in September 2022 to trigger through the first MSL breakout at $30.88 and the second MSL at $39.06 to test the upper trendline for a week but fell back under.
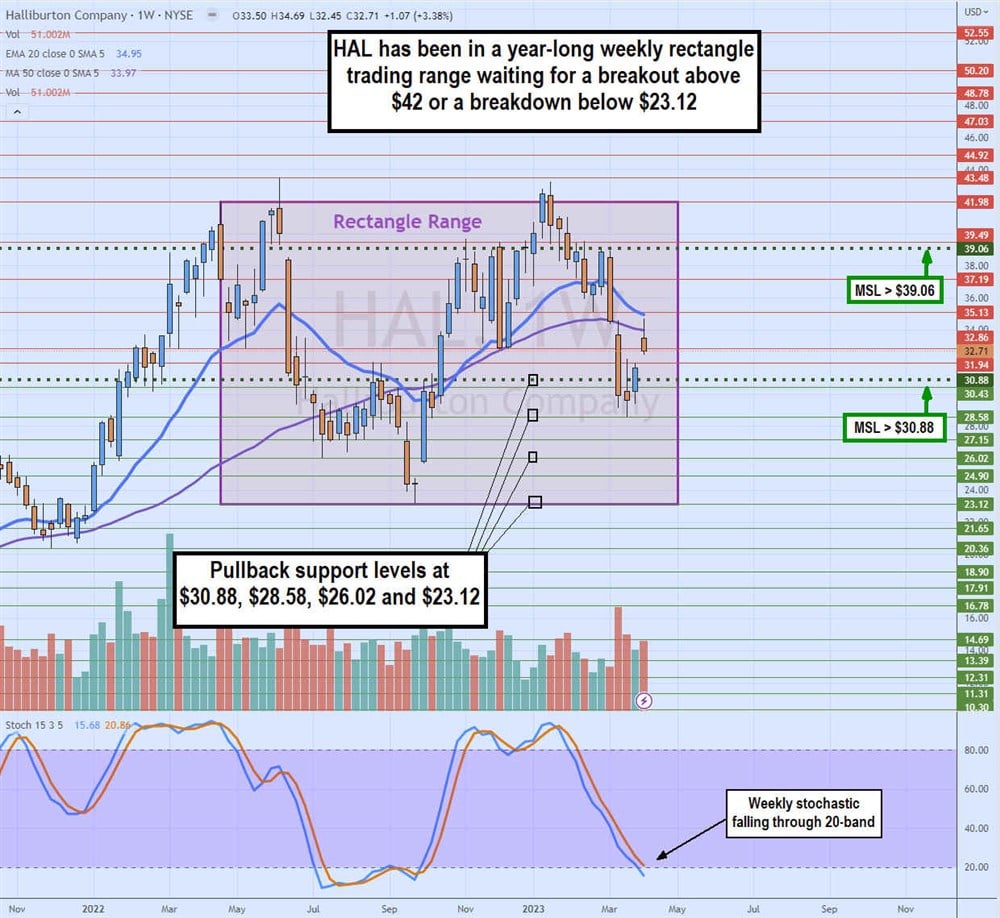
This caused the weekly stochastic to fall under the 80-band for a full oscillation down through the 20-band hitting $28.58 before attempting to stage a rally. The weekly stochastic is still falling. The weekly 20-period exponential moving average (EMA) resistance is $34.95, followed by the 50-period MA resistance at $33.97. Pullback support levels are $30.88, $28.58, $26.02, and $23.12.


