

The year 2023 will be remembered as the NYSE: AI">tipping point for artificial intelligence (AI) in the computer and technology sector. It was the year AI went mainstream and viral. Despite uncertain macroeconomic and geopolitical conditions, high interest rates, layoffs, and cost-reduction initiatives, companies still opened up their checkbooks to spend money on AI.
Year of the AI tipping point
AI went from a luxury to a necessity for enterprises to stay relevant. Some companies like Nvidia Co. (NASDAQ: NVDA) surpassed even the highest expectations as revenues jumped over 200% YoY to $18 billion with record profits in Q3 2023, while some companies didn't live up to the hype, like C3.ai, Inc. (NYSE: AI) whose revenues and losses continue to underwhelm analyst and investor expectations each quarter.
Its stock symbol “AI” and large 29.74% short interest helped drive up shares, but investors wonder if its 159% YTD gains are justified or sustainable.
Consumption model transition
C3.ai used to say its migration to a software-as-a-service (SaaS) subscription and consumption model is the reason its revenues were down at the beginning of the year. However, that excuse has lost its merits. It's understandable to see revenues initially dip, but bookings, remaining performance obligations (RPO), annual recurring revenue (ARR), backlog, or subscription growth should reflect sharp growth. However, its fiscal Q2 2024 results indicate a 12% increase in subscription revenues to $66.4 million.
The shift to the subscription model should have resulted in onboarding more clients at the cost of lower initial revenues. However, C3.ai addresses this in their slide presentation.
Revenue surge is coming in four more quarters.
C3.ai points out they are in Phase 1, three quarters into its "Consumption-Based Revenue Transition," which is the Introduction and Transition stage. Phase 2 is the Deal Ramp & Early Consumption stage, lasting until quarter seven. Phase 3 is the "Scale Out & Consumption Acceleration Stage," which is where the big revenue surge should happen in quarter eight, so the big revenue acceleration is expected in about four more quarters. Check out the sector heatmap on MarketBeat.
Slow and steady wins the race?
On Dec. 6, 2023, C3.ai reported a fiscal Q2 2024 EPS loss of 13 cents versus consensus estimates for a loss of 18 cents, a 5-cent beat. Net loss was 59 cents per share. Revenues rose 73.2% YoY to $73.2 million, missing analyst estimates of $74.33 million. Subscription revenues rose 12% YoY to $66.4 million, which comprised 91% of total revenues. Customer engagement rose 81% to 404. The company closed the quarter with $762.3 million in cash, cash equivalents and investments. The company closed 62 agreements and 36 pilots in the quarter.
In-line guidance
C3.ai expected fiscal Q3 2024 revenues of $74 to $78 million versus $77.69 million analyst estimates. Non-GAAP losses are expected to be between $40 million and $46 million. The company expects fiscal full-year 2024 total revenues between $295 million to $320 million. Non-GAAP full-year losses are expected to be between $115 million and $130 million. Get AI-powered insights on MarketBeat.
CEO Insights
C3.ai CEO Thomas Seibal commented, “It was a solid quarter, with total revenue growing 17% year-over-year to $73.2 million, and customer engagement growing by 81% year-over-year. We saw unprecedented interest and traction in our generative AI offerings. Importantly, we are seeing a return to accelerating revenue growth as we continue our transition to a consumption-based pricing model.” Seibel continued, “In the trailing four quarters, we have seen top-line year-over-year revenue growth increase from -4% in Q3 FY23, to 0% in Q4 FY23, to 11% in Q1 FY24, to 17% in Q2 FY24."
C3.ai analyst ratings and price targets are at MarketBeat. C3.ai’s peers and competitor stocks can be found with the MarketBeat stock screener.
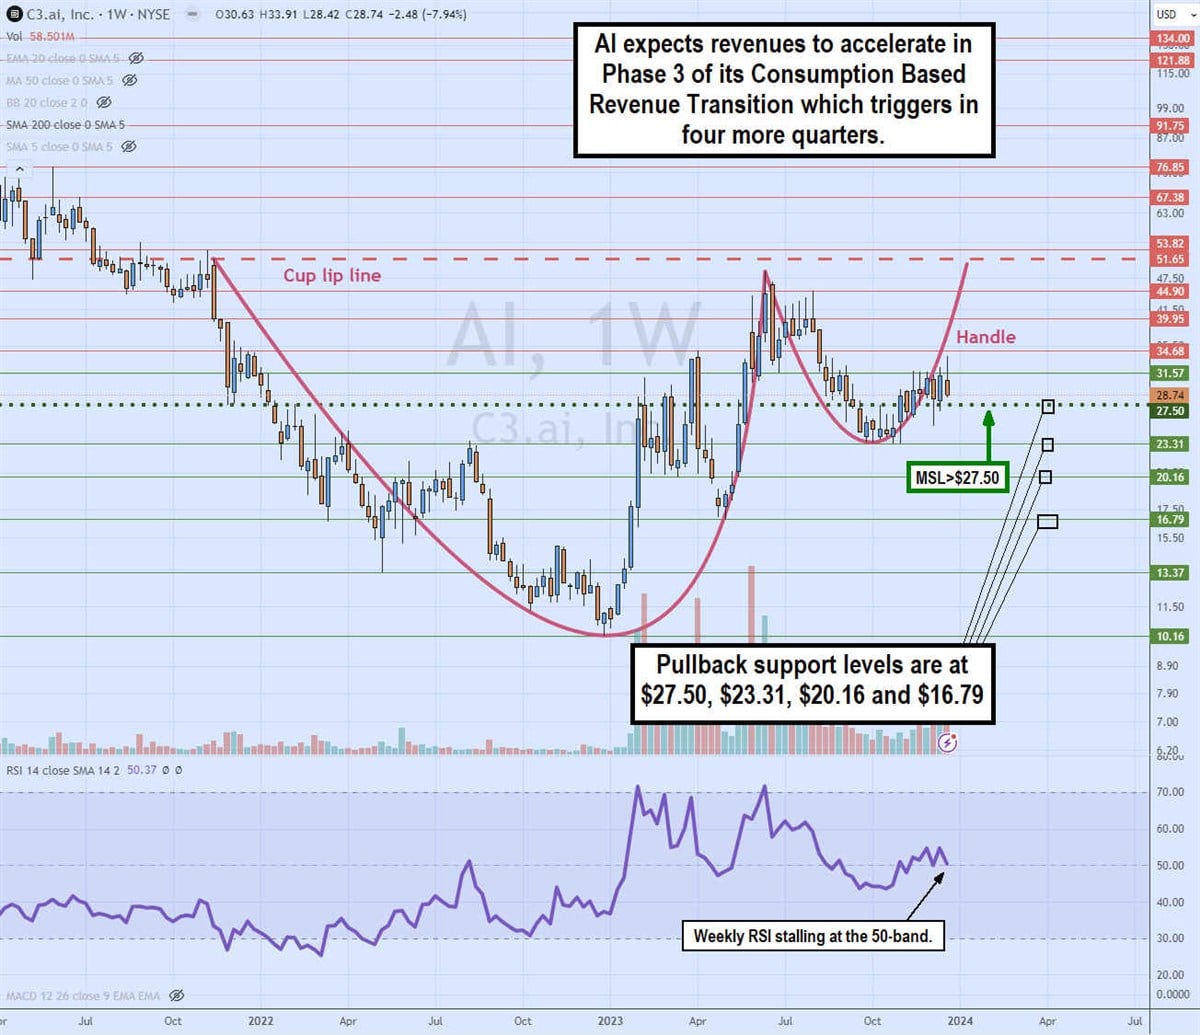
Weekly cup and handle
The weekly candlestick chart on AI illustrates a cup and handle pattern. The lip line commenced at $51.65 in November 2021 before AI sunk to a low of $10.16 by December 2022. Shares staged a rally back to $34.68 by April 2023 before sinking back down to $16.79 and triggering the weekly market structure low (MSL) breakout through $27.50 in May 2023.
The cup lip line was almost retested in June 2023 before falling back down to $23.31 to commence the handle formation. The daily relative strength index (RSI) stalled at the 50-band. Pullback support levels are at $27.50 weekly MSL trigger, $23.31, $20.16 and $16.79.


