 Digital payments platform PayPal, Inc. (NASDAQ: PYPL) shares have fallen (-62%) on the year and back below its 2020 pandemic lows. The Company enjoyed accelerated growth during the pandemic but now continues to see its stock deflate coming out of the pandemic and into a possible global recession. The macroenvironment has made it challenging to forecast normalized consumer e-commerce spending due to geopolitical, inflationary, supply chain pressures. This has caused the Company to temper expectations by lowering forward guidance. PayPal is aggregator of digital transformation for businesses and consumers as well as e-commerce. Online and peer-to-peer (P2P) payments is becoming a crowded space with the likes of competitors including Block (NYSE: SQ), Visa (NYSE: V), and Apple Pay (NASDAQ: AAPL). The Company is still growing its 429 million active user base, and total payment volume. It’s Venmo (P2P) app also continues to gain popularity as it grows its user base north of 70 million. It’s one of the few fintechs that is profitable on a GAAP basis. The Company suspended transactional NASDAQ: NFLX">services in Russia which impacted earnings by (-$0.03) per share and enabled send and receive services in Ukraine. The Company lapped its fiscal Q1 2021 best quarter with a 7% revenue growth to $6.5 billion excluding eBay (NASDAQ: EBAY). The Buy Now and Pay Later (BNPL) service grew its volume by 256% to $3.6 billion with over 18 million customer accounts using this feature. Venmo volume rose 12% to $58 billion. PayPal is expecting to launch its integration with Amazon.com (NASDAQ: AMZN) in the second half of the year. Prudent investors that have been patiently waiting for exposure in a leading digital wallet and payments platform can watch for opportunistic pullbacks in shares of PayPal.
Q1 2022 Earnings Report
PayPal reported its Q1 2022 earnings for the quarter ended March 2022 on April 27, 2021. The Company reported earnings-per-share (EPS) profits of $0.88 matching consensus analyst estimates for $0.88, missing by (-$0.01). Revenues grew 7.7% year-over-year (YoY) to $6.50 billion beating $6.41 billion consensus analyst estimates. Total payment volume (TPV) grew 13% to $323 billion. The Company added 2.4 million net new active accounts (NNA) or 9% to bring its total active accounts to 429 million.
Downside Guidance
PayPal lowered guidance for fiscal full-year 2022 EPS to come in between $3.81 to $3.93 versus $4.62 consensus analyst estimates. Fiscal full-year 2022 revenues are expected to grow 11% to 13% between $28.2 billion to $28.7 billion versus $29.26 billion consensus analyst estimates. This includes the expected (-$725 million) decline in eBay revenues. TPV is expects between 13% to 15%. The Company expects to add 10 million NNAs.
Conference Call Takeaways
PayPal CEO Dan Schulman acknowledged the took responsibility for the lackluster track record over the past several quarters. The shift in consumer behaviors navigating through the pandemic and uncertain macroeconomic environment has been challenging to visibility. The first quarter was the strongest quarter in history with 31% revenue growth and 84% non-GAAP EPS growth, making its comparison to fiscal Q1 2022 tough to beat but managed to lap it by 7%. Non transaction related expenses rose 8%. The BNPL service continues to grow generating $3.6 billion in volume. Braintree volume rose 61%. Venmo volume rose 12% to $58 billion on top of the 63% growth last year. Nearly 50% of its customers have installed the redesigned PayPal digital wallet and those customers tend to transact 25% more at checkout than other PayPal users. Nearly 70% of BNPL customers utilize the digital wallet. Digital wallet ARPA is double that of users who only use the checkout.
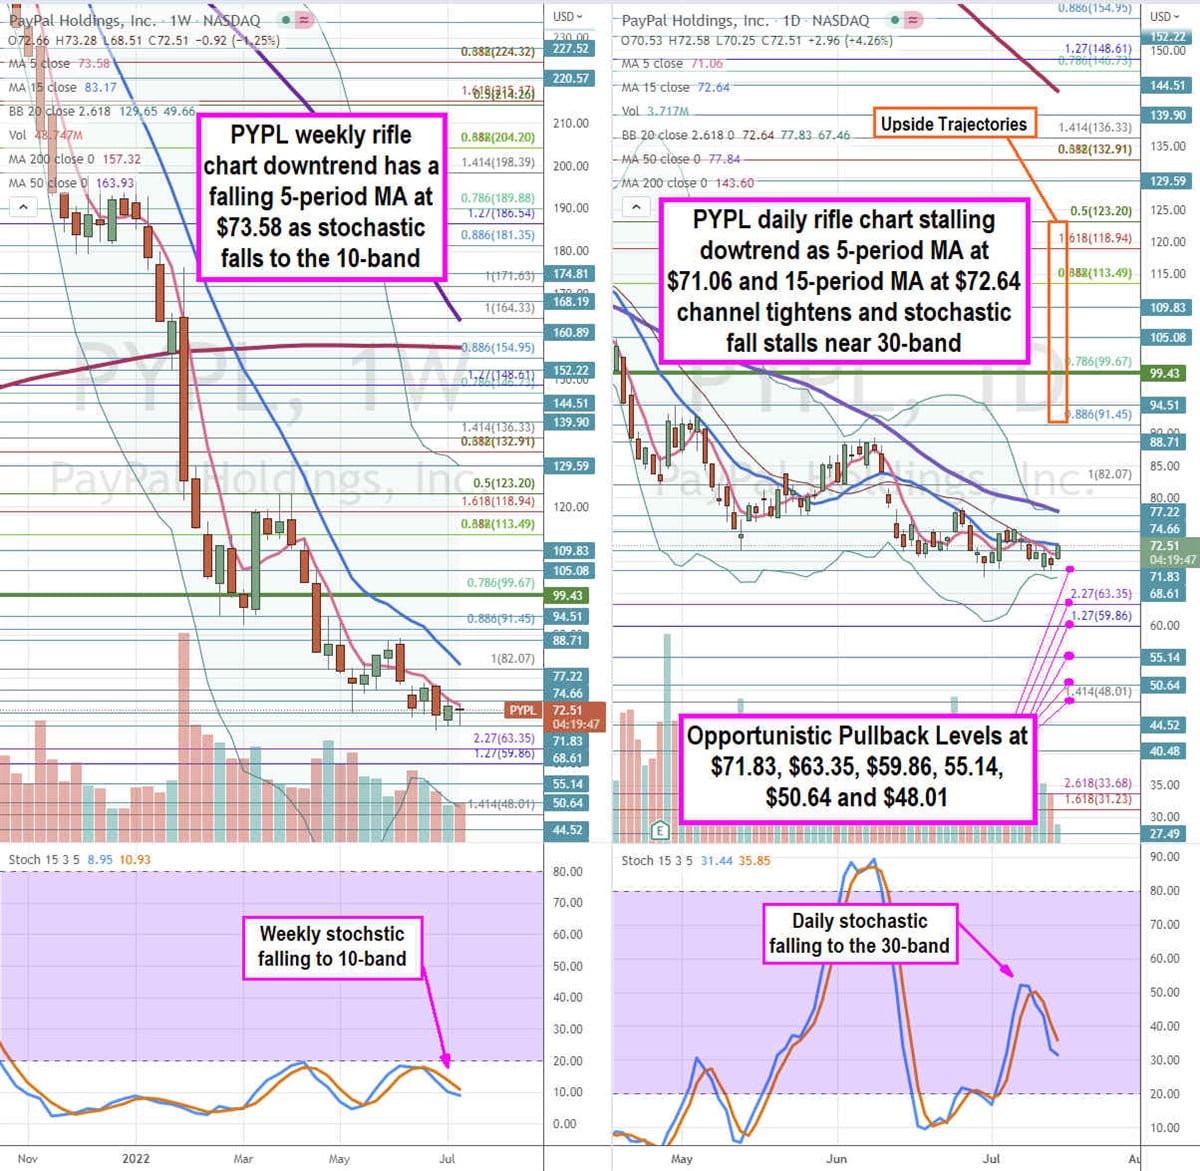
PYPL Price Trajectories
Using the rifle charts on a weekly and daily time frame provides a precision view of the landscape for PYPL stock. The weekly rifle chart formed an inverse pup breakdown on the rejection of the $123.20 Fibonacci (fib) level. The weekly rifle chart downtrend has a falling 5-period moving average (MA) resistance at $73.58 followed by the 15-period MA resistance at $83.17. The weekly stochastic rejected twice off the 20-band break attempts and is falling at the 10-band. The weekly lower Bollinger Bands (BBs) sit at $49.66. The weekly market structure low (MSL) buy triggers on a breakout through the $99.43. The daily rifle chart formed an inverse pup breakdown, but the channel is still tight with a falling 5-period MA at $71.06 and 15-period MA at $72.64. The daily lower BBs sit $67.46. The daily 50-period MA overlaps the 50-period MA at $77.84. The daily stochastic has a mini inverse pup slip testing the 30-band. The daily BBs have been in a compression which precedes a price range expansion. Prudent investors can look for opportunistic pullback entry levels at the $71.83, $63.35 fib, $59.86 fib, $55.14, $50.64, and the $48.01 fib level. Upside trajectories range from the $91.45 fib up towards the $123.20 fib level.