
A post-Thanksgiving surge in truckload freight volumes made for a solid November overall compared to previous years, reported DAT Freight & Analytics, which operates the DAT One online freight marketplace and DAT iQ data analytics service.
This press release features multimedia. View the full release here: https://www.businesswire.com/news/home/20231214133463/en/
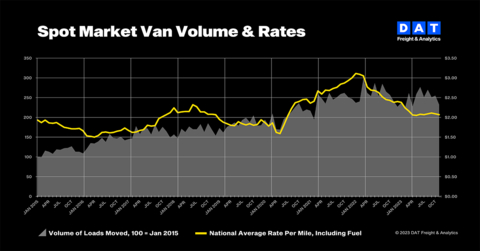
Freight volumes closed strong in November (Photo: DAT Freight & Analytics)
The DAT Truckload Volume Index (TVI), an indicator of loads moved in a month, fell for all three equipment types:
- Van TVI: 232, down 9.0% compared to October
- Refrigerated TVI: 191, down 3.5%
- Flatbed TVI: 232, down 11.1%
“Thanksgiving and Black Friday were early in the month, which meant there was almost a full week of shipment activity after the holiday,” said Ken Adamo, DAT chief of analytics. “Businesses running leaner inventories compared to the last couple of years are taking advantage of lower transportation rates as they position goods ahead of peak retail shopping.”
Market remained flush with capacity
Shippers continued to benefit from ample truckload capacity. “For every 10 carriers that left the market in November, eight new ones came in,” Adamo said. “There’s been an acceleration of capacity out of the long-haul freight sector, where carriers are subject to spot-rate volatility and high diesel costs, and a shift back to other parts of the economy, like regional dedicated operations.”
Load-to-truck ratios, which measure the number of loads posted to the DAT One marketplace relative to the number of trucks, were at their lowest point for November since 2015:
- Van ratio: 2.1, unchanged from October
- Reefer ratio: 3.2, up from 2.9
- Flatbed ratio: 5.5, down from 6.3
Low ratios signal weak negotiating power for truckload carriers. Changes in the ratio usually anticipate changes in the pricing environment.
Van, reefer line-haul rates trended higher
National average broker-to-carrier spot rates showed little movement in November. The van rate was $2.07 per mile, 2 cents less than in October, while the reefer rate increased 3 cents to $2.49 per mile. The flatbed rate rose 5 cents to $2.43 a mile. Year over year, average spot rates were down 16 cents for vans, 30 cents for reefers and 19 cents for flatbeds, accounting for lower fuel costs compared to November 2022.
Line-haul rates, which subtract an amount equal to an average fuel surcharge, strengthened after five months of declines:
- Line-haul van rate: $1.57 per mile, up 2 cents compared to October.
- Line-haul reefer rate: $1.94 a mile, up 7 cents.
- Line-haul flatbed rate: $1.83, unchanged.
Last month’s rates were higher than in November 2019, before the supply chain disruptions of the pandemic. At that time, the benchmark van line-haul rate was $1.52 per mile, the reefer rate was $1.85 and the flatbed rate was $1.74.
Rates for contracted van and reefer freight declined for the third straight month as pricing power continued to swing toward shippers. DAT’s benchmark contract van rate fell 3 cents to $2.53 per mile in November, while the reefer rate fell 3 cents to $2.94. The flatbed rate rose 4 cents to $3.17.
At 46 cents, the gap between spot and contract van rates was the lowest since March 2022, when the average broker-to-carrier spot rate was $3.05 and the contract rate was $3.26.
About the DAT Truckload Volume Index
The DAT Truckload Volume Index reflects the change in the number of loads with a pickup date during that month. The actual index number is normalized monthly to accommodate new data sources without distortion. A baseline of 100 equals the number of loads moved in January 2015, as recorded in DAT RateView, a truckload pricing database and analysis tool with rates paid on an average of 3 million loads per month.
Spot truckload rates are negotiated for each load and paid to the carrier by a freight broker. National average spot rates are derived from payments to carriers by freight brokers, third-party logistics providers, and other transportation buyers for hauls of 250 miles or more with a pickup date during the reported month. Line-haul rates subtract an amount equal to an average fuel surcharge. DAT’s rate analysis is based on $150 billion in annualized freight transactions.
About DAT Freight & Analytics
DAT Freight & Analytics operates the largest truckload freight marketplace in North America. Shippers, transportation brokers, carriers, news organizations and industry analysts rely on DAT for market trends and data insights based on more than 400 million freight matches and a database of $150 billion in annual market transactions.
Founded in 1978, DAT is a business unit of Roper Technologies (Nasdaq: ROP), a constituent of the S&P 500 and Fortune 1000 indices.
View source version on businesswire.com: https://www.businesswire.com/news/home/20231214133463/en/
Contacts
Annabel Reeves
Corporate Communications, DAT Freight & Analytics
PR@dat.com / annabel.reeves@dat.com; 503-501-0143
Stephen Petit
SiefkesPetit Communications
425-443-8976


