
Perhaps one of the more frustrating names within the broader artificial intelligence ecosystem is Ambarella (AMBA). A semiconductor specialist, Ambarella focuses on system-on-a-chip designs, which integrate HD video, image and audio processing onto a single canvas. To use industry lexicon, the company’s acumen is centered on a concept known as inference at the edge.
No, Ambarella isn’t training massive AI models like what Nvidia (NVDA) is doing. Instead, Ambarella’s chips run trained AI models directly inside devices. Fundamentally, this edge AI capability reduces latency, lowers bandwidth usage, improves privacy and saves power. As such, the tech enterprise’s products are essential for real-world, always-on vision systems — we’re talking cars, factories, cities and security infrastructures.
Unfortunately for investors, the underlying relevance hasn’t translated neatly into share price performance. For example, in the trailing year, AMBA stock is down more than 4%, even though Ambarella consistently beats earnings and revenue expectations.
So, what gives? Essentially, AMBA stock suffers from buy-the-rumor, sell-the-news dynamics. Plus, it appears that Wall Street has placed high expectations on edge AI applications while also imposing perceived execution risk penalties. You could argue that Ambarella deserves a higher premium but investors are, for better or for worse, stuck in “show-me” mode.
Still, the pensiveness toward AMBA stock could present an opportunity for contrarian options traders. Right now, Barchart’s Expected Move calculator pegs the forward dispersion for the Feb. 20 expiration date as landing between $62.17 and $79.51. In magnitude terms, AMBA is expected to swing 12.24% in either direction relative to the current anchor price.
What’s really fascinating about this calculator — and it’s a hidden weapon when wielded carefully — is that it offers the first step in uncovering a potential structural arbitrage. To cut through the math, the “probability of profit” (which is derived from the underlying Black-Scholes formula) assumes a probabilistic fulcrum based on distance from the anchor.
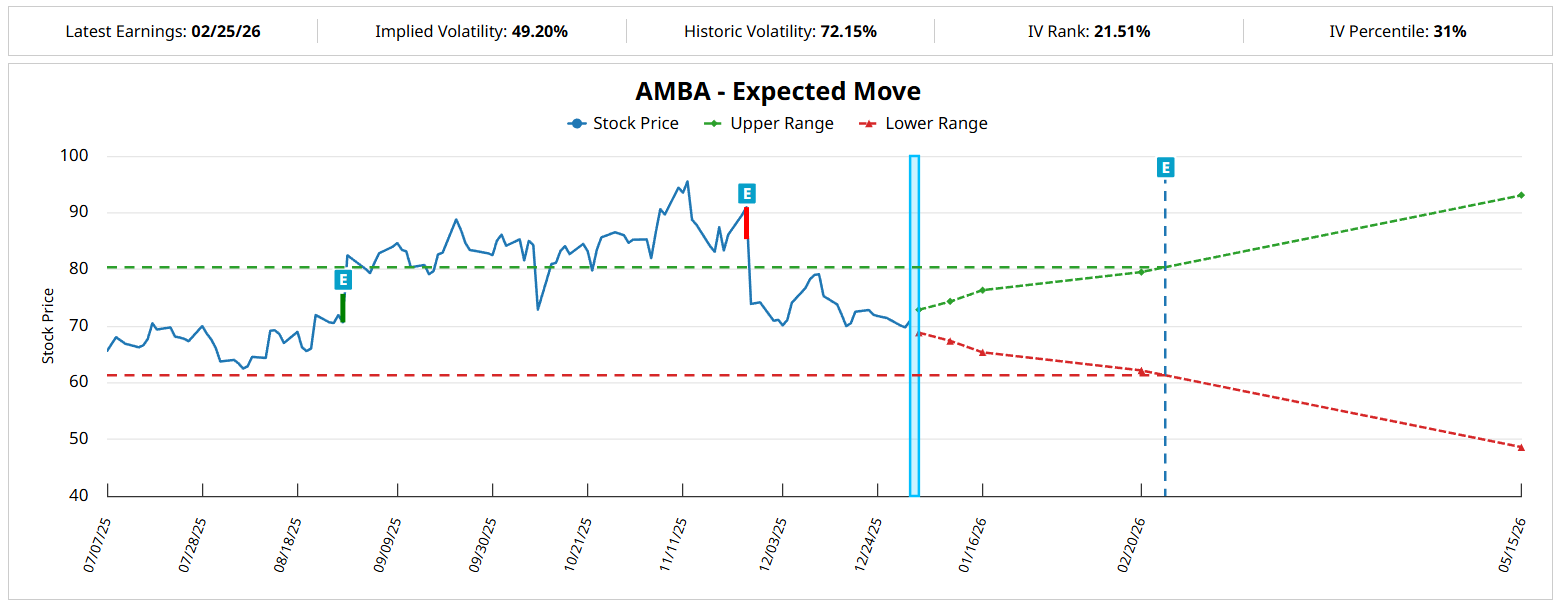
For example, AMBA stock closed on Wednesday at $70.84. Therefore, under the Black-Scholes geometry, AMBA hitting $71 will always have a higher probability of success than AMBA hitting $75.
What if I told you that’s not always true?
Exposing the Structural Arbitrage of AMBA Stock Hidden in Transitional Logic
One nuance that must be articulated is that, under a bullish speculative framework, reaching a lower-priced target usually yields a greater probability of success than hitting a higher-priced target, all other things being equal.
This is just basic sports logic, yeah? Everybody knows that making a layup offers a higher probability of success than sinking a three-pointer. Under the Black-Scholes universe, outcome probability is inversely correlated with distance from the center (the anchor price or starting point). As a radial formula, this conclusion is mathematically unavoidable.
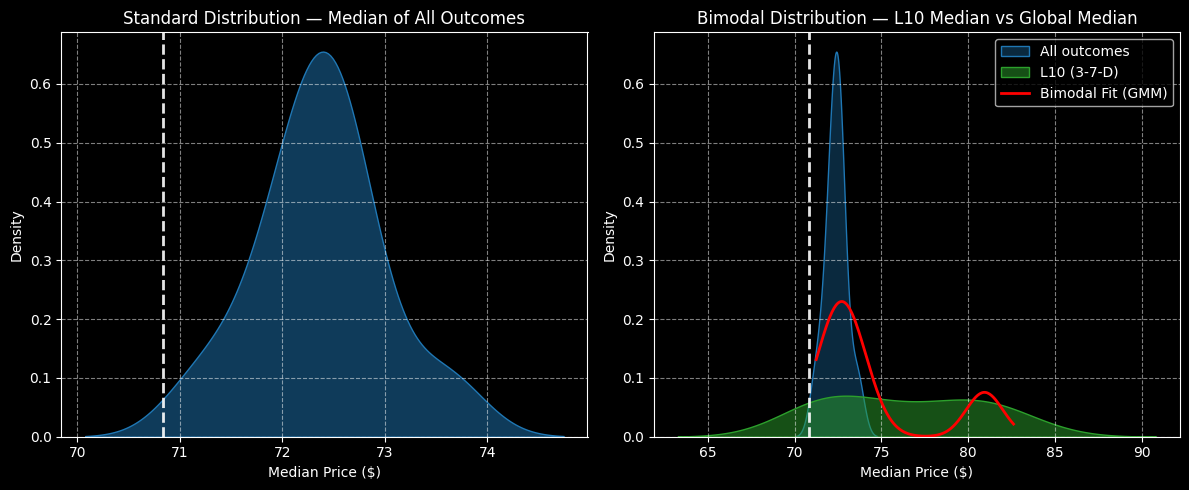
However, under a topological framework, outcome probability is inversely correlated with distance from the center of probability mass. In other words, what structural arbitrageurs are claiming is that the terminal price of a security over a fixed time period could be landing in a narrow range rather than somewhere in a wide dispersion.
What’s more, the arbitraged range might not be monotonically calculated. Stated simply, under certain circumstances, it may be easier for a player to sink a three-pointer rather than to attempt a layup.
I’m not a big basketball fan but you don’t need to be an expert to realize the truth of the analogy. In some circumstances, the defenders may be stacked in such a way that making a layup would be next to impossible. Therefore, a player — especially one on a hot streak — may have far better odds going for an uncontested three-pointer.
Using a similar logic, I’m noticing that in the last 10 weeks, AMBA stock has printed only three up weeks, leading to an overall downward slope. Under this setup, one might presume a pessimistic outlook given the extensive bearish pressure. However, by using a topological, hierarchical framework, we find that in past analogs going back to January 2019, this 3-7-D sequence (three up, seven down, downward trend) typically leads to a contrarian and bullish result.
Usually (but not always), AMBA stock over the next 10 weeks would be expected to land between $64 and $90, with probability density thickest between $71 and $82. Therefore, it might be worthwhile to be more aggressive than usual.
Risk Topography Reveals an Enticing Opportunity
Looking at risk topography — a three-dimensional view of probability mass that incorporates expected price, probability density and population frequency — we can see that under 3-7-D conditions, there is expected to be significant activity between the $80 and $82 price points.
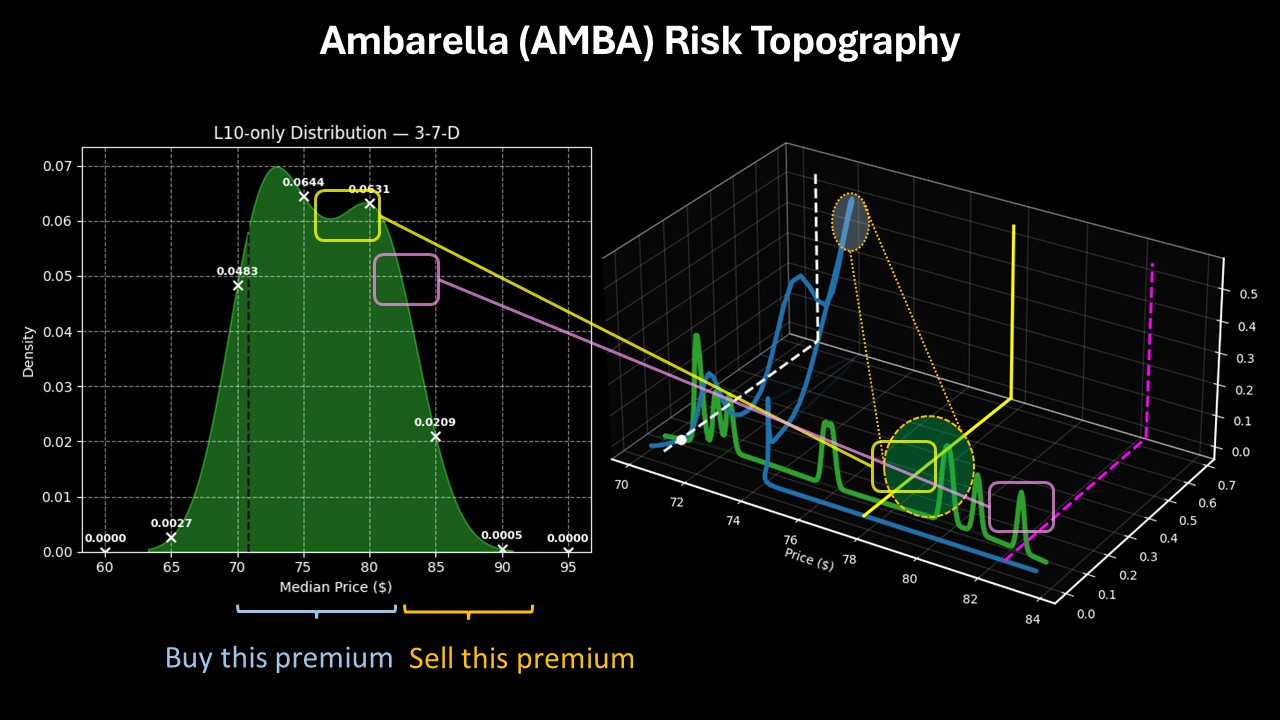
Basically, over the next 10 weeks, AMBA stock will likely travel through the aforementioned range before settling on a terminal basis at around $75. My hypothesis is that, because of extensive volatility in Ambarella stock since early November, a reflexive move may result in a higher-than-normal terminal price.
Subsequently, I’m very tempted with the 75/82.50 bull call spread expiring Feb. 20, 2026. This trade requires AMBA stock to rise through the $82.50 strike at expiration, which could be in play given the data we’re seeing from the security’s risk topography. Also, the breakeven price sits at $77.85, which I consider a very reasonable target.
Should the second-leg strike be triggered at expiration, the maximum payout stands at over 163%. For that kind of reward, speculators are arguably incentivized to consider going for it.
On the date of publication, Josh Enomoto did not have (either directly or indirectly) positions in any of the securities mentioned in this article. All information and data in this article is solely for informational purposes. For more information please view the Barchart Disclosure Policy here.
More news from Barchart
- As MicroStrategy Buys $109 Million of Bitcoin, Should You Buy MSTR Stock?
- Wall Street’s Radial Framework Potentially Exposes a Mispriced Opportunity in Ambarella (AMBA) Stock Options
- A $1 Billion Catalyst Just Hit Coupang. How Should You Play CPNG Stock Here?
- Alphabet Soars — Is GOOGL Stock Still a Buy for 2026?


