
It’s common knowledge that the faster you hit a baseball — all other things being equal — the more it’s going to fly. By the same logic, market behaviors can be forecasted by studying the response to certain impacts. For example, a routine HR announcement probably isn’t going to move the needle as much as a massive earnings beat and guidance hike.
Further, it stands to reason that traders mostly base their acquisition and distribution decisions on what has materialized in the immediate past. For example, volatility usually begets more volatility. Still, at some point, the red ink becomes so extensive that the affected security starts to look like a discount.
Such thinking in my mind leads to a natural three-step process:
- Screen for beaten-down securities
- Look up the potential range of outcomes using standard methodologies like Black-Scholes
- Utilize probabilistic analysis to narrow down where prices are likely to cluster
For the below ideas, I am banking on the observed tendencies of how securities under bearish pressure respond over the course of the next 10 weeks. I’ve only picked ideas that have demonstrated reliable bounce-back tendencies.
Of course, no one can know the future as outside elements can always disrupt the informational paradigm. Nevertheless, the theory is that, if we hold true to the numbers, over many trades, we should win out more than we lose. With that, let’s get started.
Cadence Design Systems (CDNS)
While Cadence Design Systems (CDNS) has been one of the top movers recently — with CDNS stock gaining 4% in the trailing month — it’s been struggling since the tail end of October. As such, the Barchart Technical Opinion indicator rates shares as a 40% Buy. Put another way, most traders likely view Cadence as a neutral-to-slightly-bullish idea. Still, the quantitative data suggests a more decisive outlook.
Running a bespoke algorithm on CDNS stock price data, the forward 10-week returns of CDNS stock can be arranged as a distributional curve, with outcomes ranging between $323 and $373 (assuming an anchor price of $337.53, Friday’s close). Price clustering would likely land around $350.
The above assessment aggregates data since January 2019. However, we’re interested in the current signal, which is a 3-7-D formation; that is, in the past 10 weeks, CDNS stock printed three up weeks and seven down weeks, with an overall downward slope. Under this setup, outcomes will likely range between $327 and $383, with price clustering potentially prominent at $362.
What’s interesting here is the shape of risk. Between $366 and $370, probability density — or the relative likelihood of price clustering — drops precipitously. Between $370 and $380, density gets obliterated.
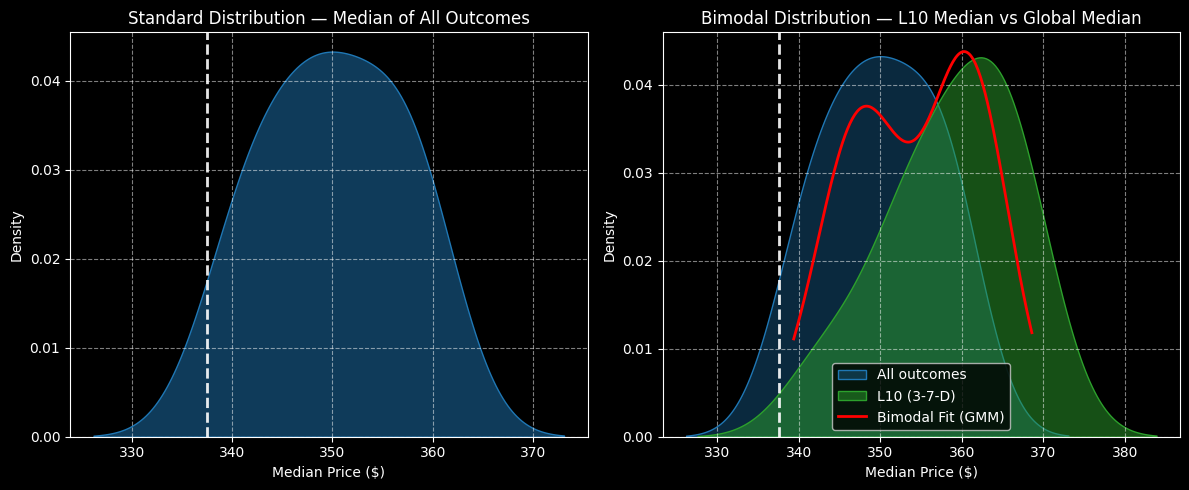
By understanding the shape of risk, we can surmise that it’s probably best to place the max profitability target in a vertical spread right at the point before the density drop-off. Using the spread pricing layout provided by Barchart Premier, the ideal trade appears to be the 360/365 bull call spread expiring Jan. 16, 2026.
Oscar Health (OSCR)
Moving into more speculative fare is Oscar Health (OSCR). Right now, the Barchart Technical Opinion indicator rates OSCR stock as a Hold, noting that the outlook is falling. To be upfront, this is a rare assessment. I can’t remember the last time this rating materialized. Still, the quantitative data suggests that aggressive speculators will want to take a closer look.
As circumstances stand on the aggregate, the forward 10-week returns of OSCR stock can be arranged as a distributional curve, with outcomes ranging between $15.60 and $17.50 (assuming an anchor price of $16.77). Moreover, price clustering is likely to be prominent at $16.60.
However, the current signal — a 3-7-D sequence — dramatically changes the expected range of outcomes. Under this condition, OSCR stock would be expected to land between $13.80 and $21.90, with price clustering likely to be predominant at $17. Interestingly, this range is similar to what the Black-Scholes model calculated for the Jan. 16 options chain, with the exception being that I see a bit of a fat tail on the reward side.
Of course, in terms of the positive variance between the baseline and conditional clusters, there’s not much difference. However, there’s more to this story.
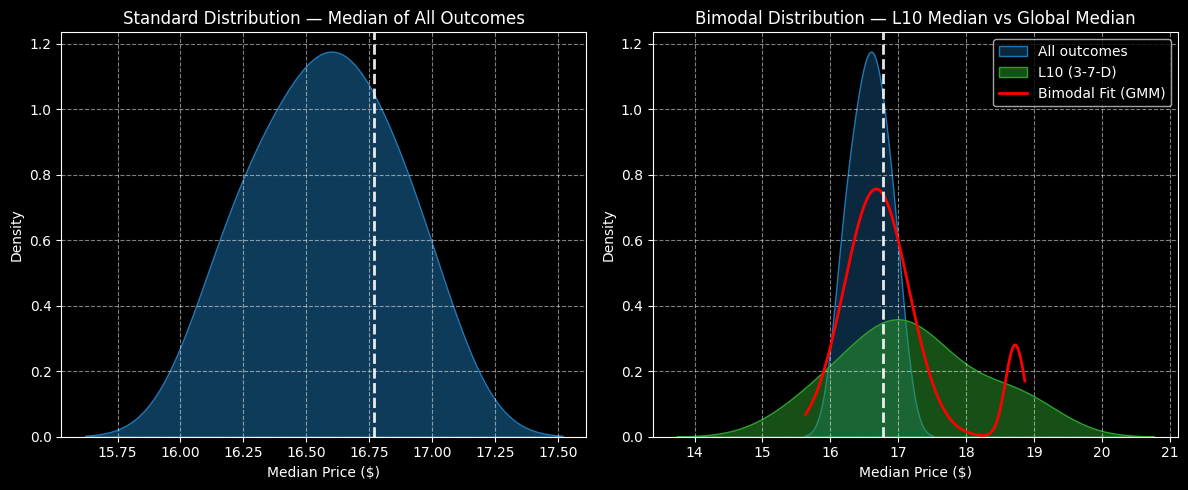
Essentially, the 3-7-D sequence’s risk geometry is more forgiving in that the descent of probability density occurs more gradually. Such a structure may allow speculators to be more aggressive than usual. I wouldn’t necessarily be opposed to the 17/19 bull spread expiring Jan. 16.
Chewy (CHWY)
One of the more frustrating names this year, Chewy (CHWY) hasn’t moved anywhere on a year-to-date basis. Since it doesn’t pay a dividend, it’s been a net negative for stakeholders. Not surprisingly, the Barchart Technical Opinion indicator rates CHWY stock as a 100% Strong Sell. The fact that CHWY lost roughly 31% in the trailing half-year period didn’t help matters.
Still, from a speculative standpoint, Chewy could be one of the more intriguing names. With an earnings report coming up on Dec. 10 before the opening bell, there’s a good chance of volatility in either direction. That said, if we set aside the financial disclosure, the statistical backdrop seems rather compelling.
As a baseline calculation, the forward 10-week returns of CHWY stock will likely range between $32.13 and $34.60 (assuming an anchor price of $33.47). Price clustering should be predominant at around $33.80.
However, under the current 3-7-D signal, forward outcomes should land between $28.75 and $46.80, with price clustering predominant at approximately $38.50. However, the shape of risk is unusual relative to the baseline as it covers a vast price range. In other words, the descent in probability density is very gradual rather than steep.
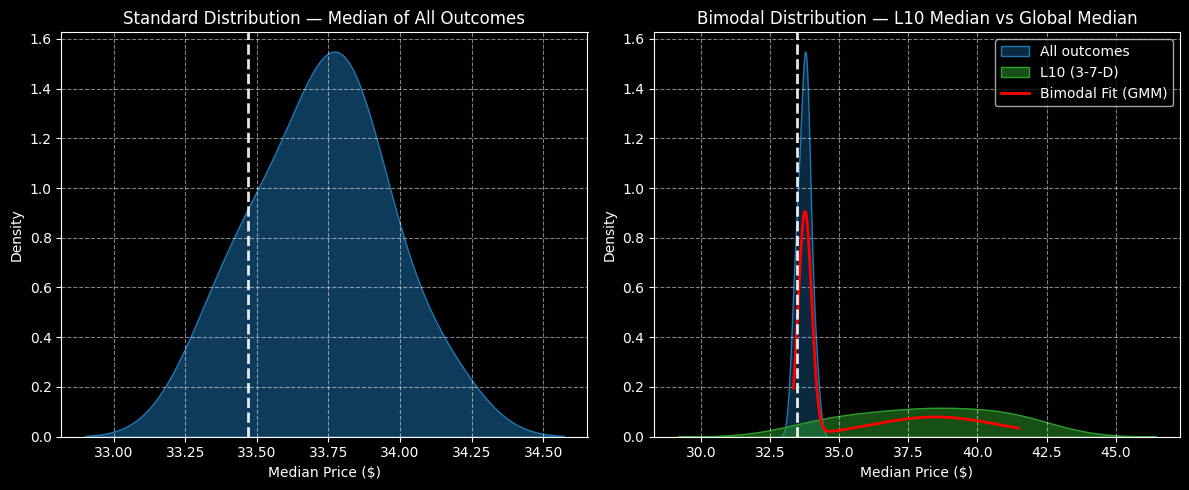
Theoretically, then, traders can be more aggressive than usual. I’m very tempted with the 37.50/40.00 bull spread expiring Jan. 16, which offers a max payout approaching 300%.
On the date of publication, Josh Enomoto did not have (either directly or indirectly) positions in any of the securities mentioned in this article. All information and data in this article is solely for informational purposes. For more information please view the Barchart Disclosure Policy here.
More news from Barchart
- The Saturday Spread: 3 Stocks Flashing High-Probability Trading Setups to Consider This Week
- Tesla, Netflix, and ON Semiconductor: 3 Unusually Active Cash-Secured Put Options to Sell Now
- Salesforce Generates Strong Free Cash Flow - CRM Could Be 23% Too Cheap
- Learn How This Trade Lets You Control $18,000 of Stock for $200


