
With fears of a bubble brewing in artificial intelligence consistently wreaking havoc on tech players in the fourth (calendar) quarter, semiconductor and software giant Broadcom (AVGO) has been put through the ringer. True, on a year-to-date basis, AVGO stock is doing well, gaining over 47%. However, in the trailing month, the security is down almost 10%.
What has regular, everyday investors freaked out is that even the smart money appears pensive. Take a look at Barchart’s options flow screener, which focuses exclusively on big block transactions likely placed by major institutions. On Dec. 8, a few days before its fiscal-fourth-quarter earnings disclosure, net trade sentiment stood at over $151.16 million. However, just 10 days later, net trade sentiment slipped to $148.84 million below parity.
Even though Broadcom beat on both the top and bottom lines, disappointments over a less-than-expected AI backlog, combined with concerns about operating margins, weighed heavily on AVGO stock. Basically, the central anxiety is that, with the low-hanging AI fruit being plucked, Broadcom and its ilk need to prove viability.
Because of this great overhang, it’s not terribly surprising that AVGO’s unusual options activity screener also shows structural pensiveness. While it’s important not to read too deeply into any one metric, here’s what we can largely infer. Due to very long-dated out-the-money (OTM) calls being paired with long-dated, deep in-the-money (ITM) puts, the smart money is effectively hedged for kinetic uncertainty.
If the transactions symbolized directional bets, you would expect the bulk of the transactions to feature more realistic call and put strike prices. Instead, what’s happening here is that most of these strikes are positioned to respond only at the tails of the underlying outcome distribution.
While I’m not going to sit here and pretend that I know what the smart money is thinking about, the unusual options activity points to net protection against unusual behaviors. Otherwise, the structure of activity points to a lack of confidence in where AVGO stock may go.
Using Risk Geometry to Narrow Down the Possibilities for AVGO Stock
Another clue regarding the hedging activity that’s occurring right now is the relatively heightened implied volatility (IV). If we look at Barchart’s Expected Move calculator, you’ll notice that for the options chain expiring Feb. 20, 2026, the expected range of outcomes goes from $302.85 to $380.05, thus representing an 11.3% move in either direction relative to Monday’s close.
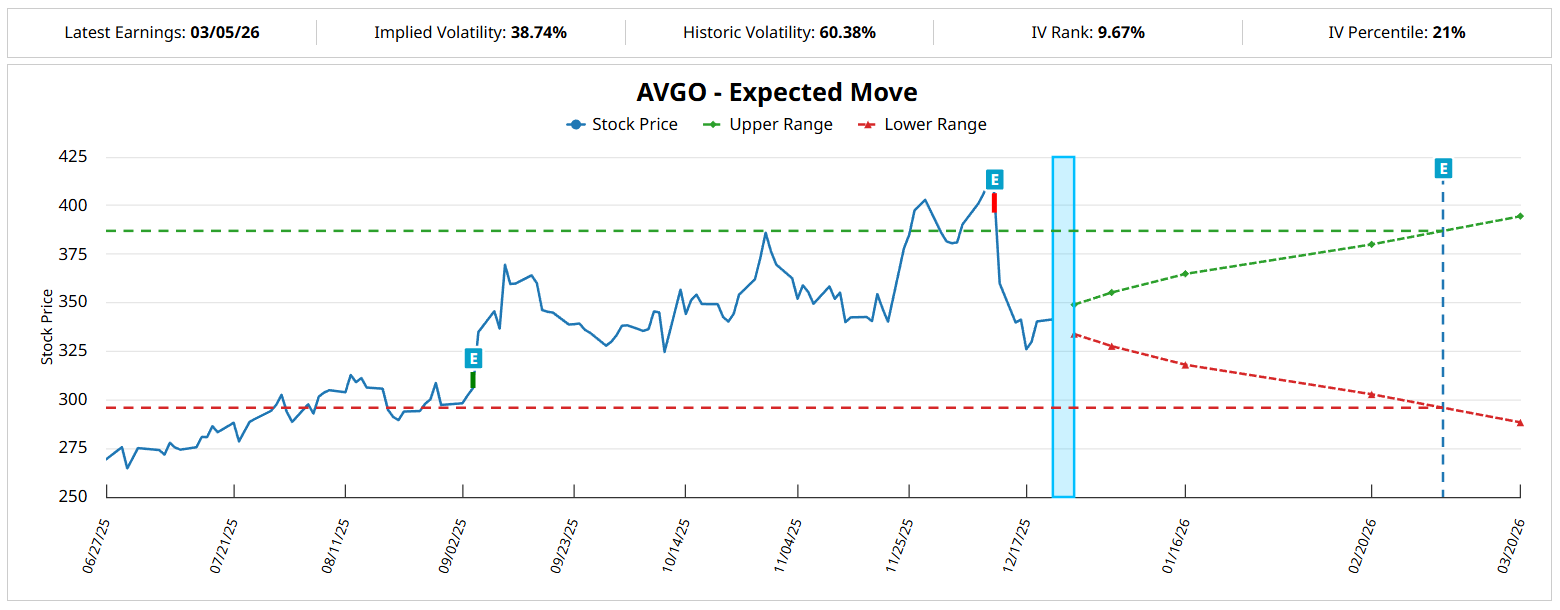
That’s a very wide dispersion, which stems in large part from IV, which is a residual value based on actual order flows. Therefore, we have a situation where AVGO stock could shoot quite high over the next two months or it could sharply correct.
For traders, you have two basic paths: you can either play the volatility game or you can take a directional wager. Personally, I prefer the latter because betting on volatility is a tricky business when IV is already heightened due to substantial hedging activities.
To make an informed decision, we must calculate the risk geometry of AVGO stock. This can be accomplished through a hierarchical distribution. If we took a single 10-week strand of AVGO’s price data, the return during this period won’t tell us much about the probability of performance for the other weeks in the dataset.
But what if we took hundreds of rolling 10-week trials and stacked them in a fixed-time distribution? Under this framework, the most consistent behaviors would create a bulge in probability mass. This bulge represents risk geometry, which tells us how buyers become more aggressive in their speculative fervor.
More importantly, risk geometry also shows us where buyers are tempted to become sellers. In this manner, we can identify both upside profit opportunities and help curtail opportunity costs.
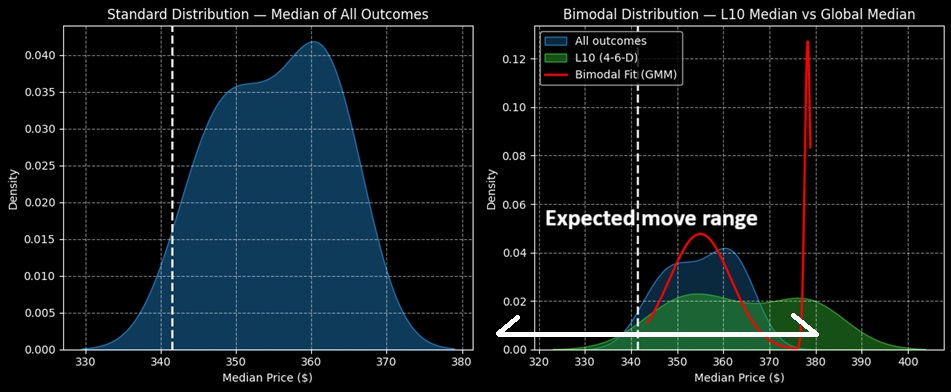
Using this hierarchical approach, we note that the typical 10-week distribution would land AVGO stock somewhere between $330 and $380, assuming an anchor price of $341.48, Monday’s close. However, the current quantitative signal is the 4-6-D sequence; that is, in the trailing 10 weeks, AVGO printed only four up weeks, leading to an overall downward slope.
Under this setup, the forward 10-week returns would typically range between $322 and $404. Further, probability mass would be thickest between $350 and $380.
Two Enticing Wagers Available to Consider
Given the market intelligence above, perhaps the most obvious trade is the 350/360 bull call spread expiring Feb. 20, 2026. With the strike price sitting right on the center of probability mass, there would seem to be a solid chance for this trade to be fully profitable.
Plus, if AVGO stock rises through the second-leg strike ($360) at expiration, the maximum payout would be roughly 133%. That’s an awfully nice reward. However, one thing to keep in mind is probability decay (or lack thereof).
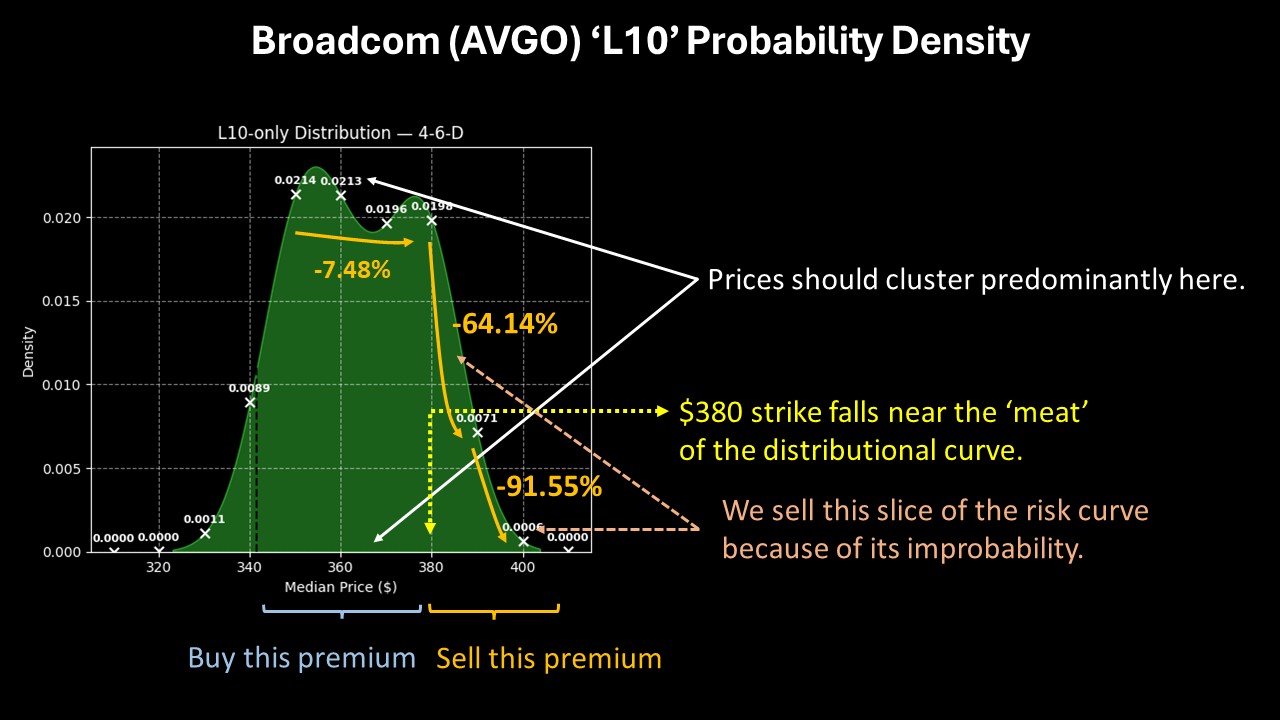
Between $350 and $380, probability density only drops by 7.48%. Based on the statistical evidence, there’s a good chance that if AVGO stock is going to hit $360, it can reasonably hit $380. Therefore, capping the reward at $360 may risk absorbing a hefty opportunity cost.
Now, the thing is, from $380 to $390, probability density drops by 64.14%. In other words, if we cap our reward at the $380 strike, the chance of us absorbing an opportunity cost is exponentially less than at $360, assuming that the same sentiment regime assumption holds.
If it does hold, you could be leaving money on the table with the 350/360 spread. Instead, the boldest idea is the 370/380 bull spread, also expiring Feb. 20.
Risky? Extremely. But you’re also looking at a payout of nearly 228%.
On the date of publication, Josh Enomoto did not have (either directly or indirectly) positions in any of the securities mentioned in this article. All information and data in this article is solely for informational purposes. For more information please view the Barchart Disclosure Policy here.
More news from Barchart
- Broadcom (AVGO) Stock Options Are Signaling Pensiveness. Here’s Why the Fear Might Be Unwarranted.
- Occidental Petroleum Stock Has Tanked - But It May Hike Its Dividend - Time to Buy?
- Dogs of the Dow Enhanced Income Strategy with Covered Calls
- This Michael Burry Stock Spiked on a $1B Activist Stake. How Our Top Analyst Found the Trade Early.


