
Their head office is in Nanping, a city recognized as the "birthplace of the Chinese amusement park industry," and collectively the company has 426,560 square meters of operational land. GDHG's portfolio of attractions are strategically located in southern China, accessible to around 21 million people. In addition to amusement parks, GDHG has complementary offerings including restaurants and food stalls, which also positively contribute towards revenue.
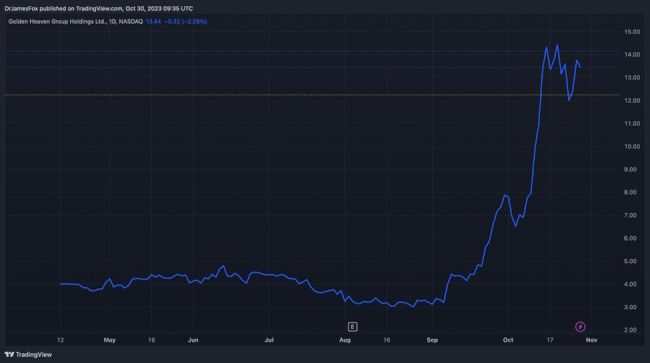
Following their IPO in April, where shares were priced at $4, we've witnessed a 254% surge in the share price - this can be seen in Figure 1. This suggests growing investor interest, potentially driven by GDHG's growth potential, industry positioning, and expansion plans, despite the challenges posed by the market conditions.
Technicals
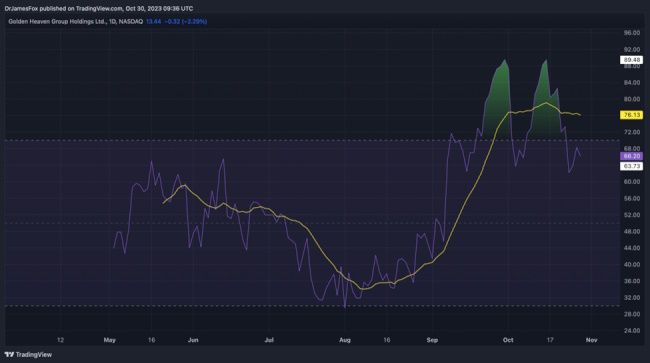
The Relative Strength Index (RSI) is a technical indicator that provides insights into the momentum and potential overbought or oversold conditions of a financial asset. RSI values above 70 typically suggest overbought conditions, indicating a possible price correction or reversal to the downside, while values below 30 indicate oversold conditions, suggesting a potential buying opportunity or a price rebound. As we can see from the below, GDHG currently has an RSI value below 70, while the moving average sits above 70 suggesting overbought conditions. However, this is by no means conclusive. Investors should also consider the company's positive momentum and valuation metrics.
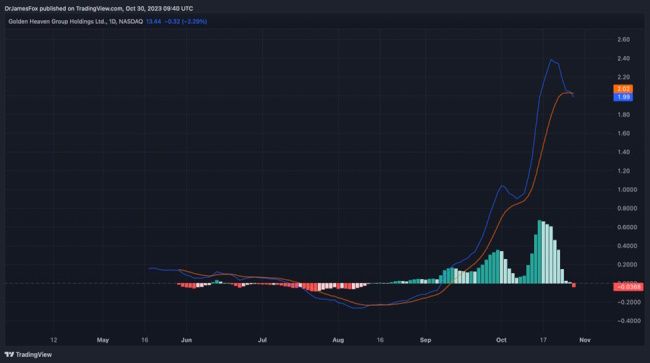
The Moving Average Convergence Divergence (MACD) is a popular technical indicator used to assess the strength, direction, and potential reversals in the price trends of financial assets. It achieves this by comparing short-term and long-term moving averages, with the MACD line representing the difference between these moving averages and the signal line showing the smoothed version of the MACD line. Crosses between these lines can signal buy and sell opportunities, while the MACD histogram helps identify changes in momentum, offering valuable insights for traders and investors. Currently we can observe that the MACD line and the smoothed version of the MACD line have just crossed. However, momentum is yet to turn fully.
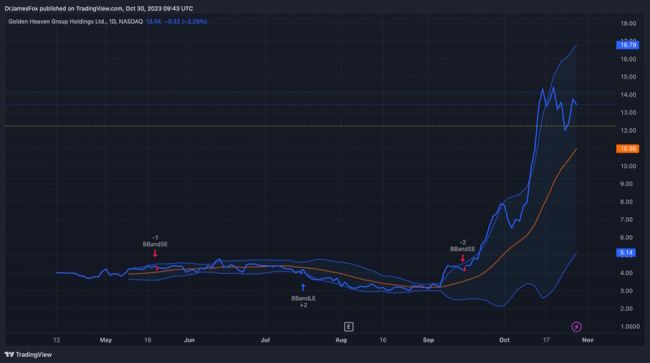
Bollinger Bands are a technical indicator that provides insights into the volatility and potential price levels of a financial asset. They consist of three lines: a middle band, which is typically a simple moving average, and two outer bands that are derived from standard deviations. The width of the bands expands and contracts in response to price volatility. When prices approach or touch the outer bands, it suggests overbought or oversold conditions, potentially signalling a reversal or correction. As we can see, the orange line, representing the moving average, currently sits in the middle of the range, inferring, given the positive momentum, that there could be more to the rally.
High Risk, High Reward
None of the three of these metrics suggest the amusement park owner's bull run will come to an end, however it's clear momentum is slowing. This is partially supported by valuation metrics, although it's by no means conclusive. GDHG currently trades at 23.1 times trailing twelve-month (TTM) earnings, representing a 52% premium to the consumer discretionary sector. However, compared to international peers, it doesn't appear excessively expensive - for instance, US giant Six Flags Entertainment Corporation trades at 21.5 times TTM earnings. However, it's worth highlighting that Cedar Fair is much cheaper, trading at just 7.4 times TTM earnings.
This premium can be attributed to GDHG's remarkable earnings per share growth and the positive sentiment surrounding the sector's growth in China. In the first half of 2023, the company's revenues exceeded RMB 140 million, marking a 6% increase from the same period in 2022. Gross profit for H1 2023 also improved, reaching RMB 101 million, a 7.5% increase from H1 2022, with a gross margin of 71.37%, up 1.02 percentage points from the previous year. Net income saw a significant 12% year-on-year increase, and earnings per share surged impressively by 135.1%, reaching RMB 1.05 in H1 2023 compared to RMB 0.45 in H1 2022.
The amusement park market is also forecast to grow significantly, with a compound annual growth rate (CAGR) of 15% between 2022-2027. The anticipated growth will be fueled by several factors, such as the increasing disposable income of Chinese consumers, the ongoing urbanization of the country, bringing more customers within range of the parks, and the rising trend of family tourism.
In conclusion, GDHG appears a high risk, high reward investment. Stock float suggests high volatility, but the share price rally is support by continued positive momentum, and no warning signs from the technical data.
By Rickie Wang
]]>Copyright 2023 ACN Newswire . All rights reserved.


