WHITE ROCK, BC / ACCESSWIRE / May 1, 2023 / TDG Gold Corp. (TSXV:TDG) (the "Company" or "TDG") is pleased to announce an updated Mineral Resource Estimate1 ("MRE") incorporating the results of its 2022 Phase 2 drill program at the former producing Shasta gold-silver ("Au-Ag") mine. The key outcomes were increased grade, increased contained ounces and a substantial improvement of the classification of the mineral resources. An updated technical report will be filed on the Company's website and SEDAR within 45 calendar days of this disclosure.
Highlights: 2023 Expanded & Upgraded Mineral Resource Estimate (see Table 1; below for details)
- Indicated Mineral Resource of 514.8 thousand ounces ("koz") gold equivalent ("AuEq"2) grading 1.27 grams per tonne ("g/t") AuEq2, contained within 12.6 million metric tonnes ("Mt").
- Inferred Mineral Resource of 496.3 koz AuEq2 grading 1.00 g/t AuEq2, contained within 15.4 Mt.
- Increased cut-off grade for new base case scenario: 0.4 g/t AuEq2 cut-off grade ("COG") versus the 0.3 g/t AuEq2 COG used in 2022 MRE1.
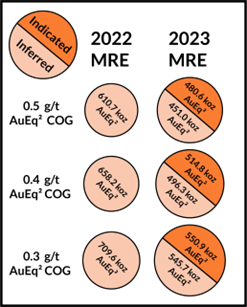
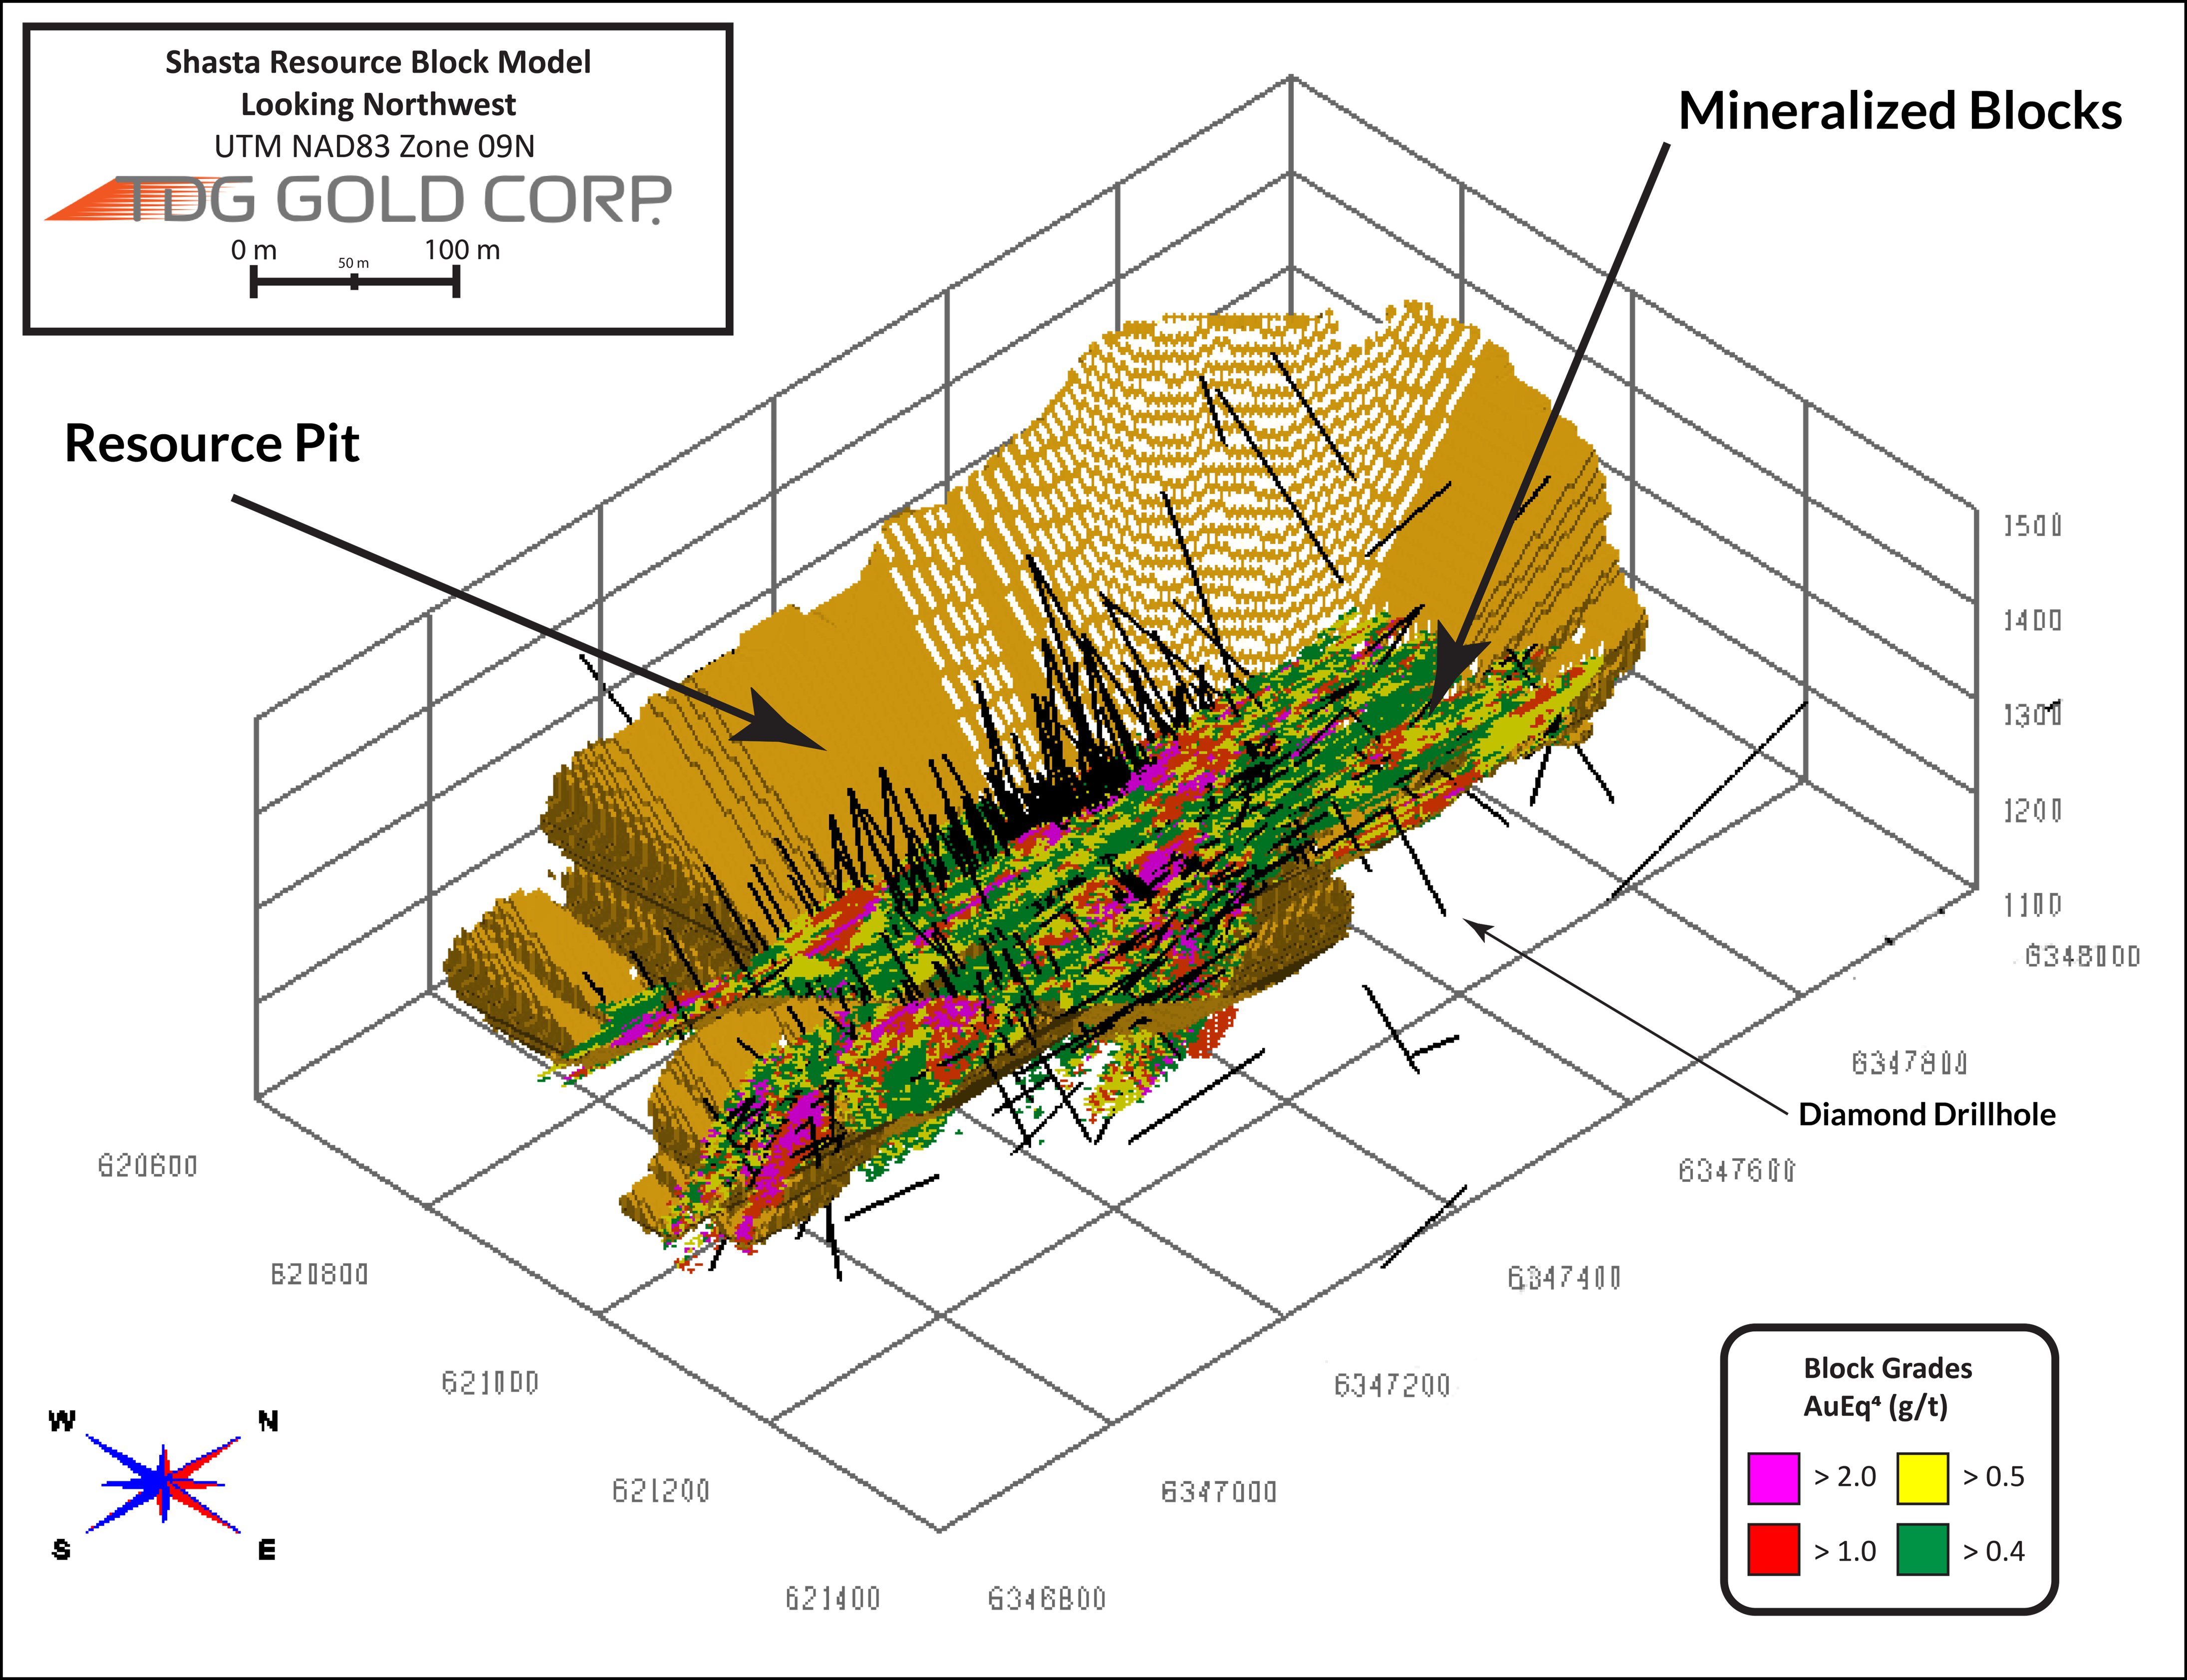
- MRE expanded to include the Cayley-Rainier zone to the south (Figure 1).
- MRE pit outline extends to within 100 m of the Newberry exploration target zone3 (Figure 1).
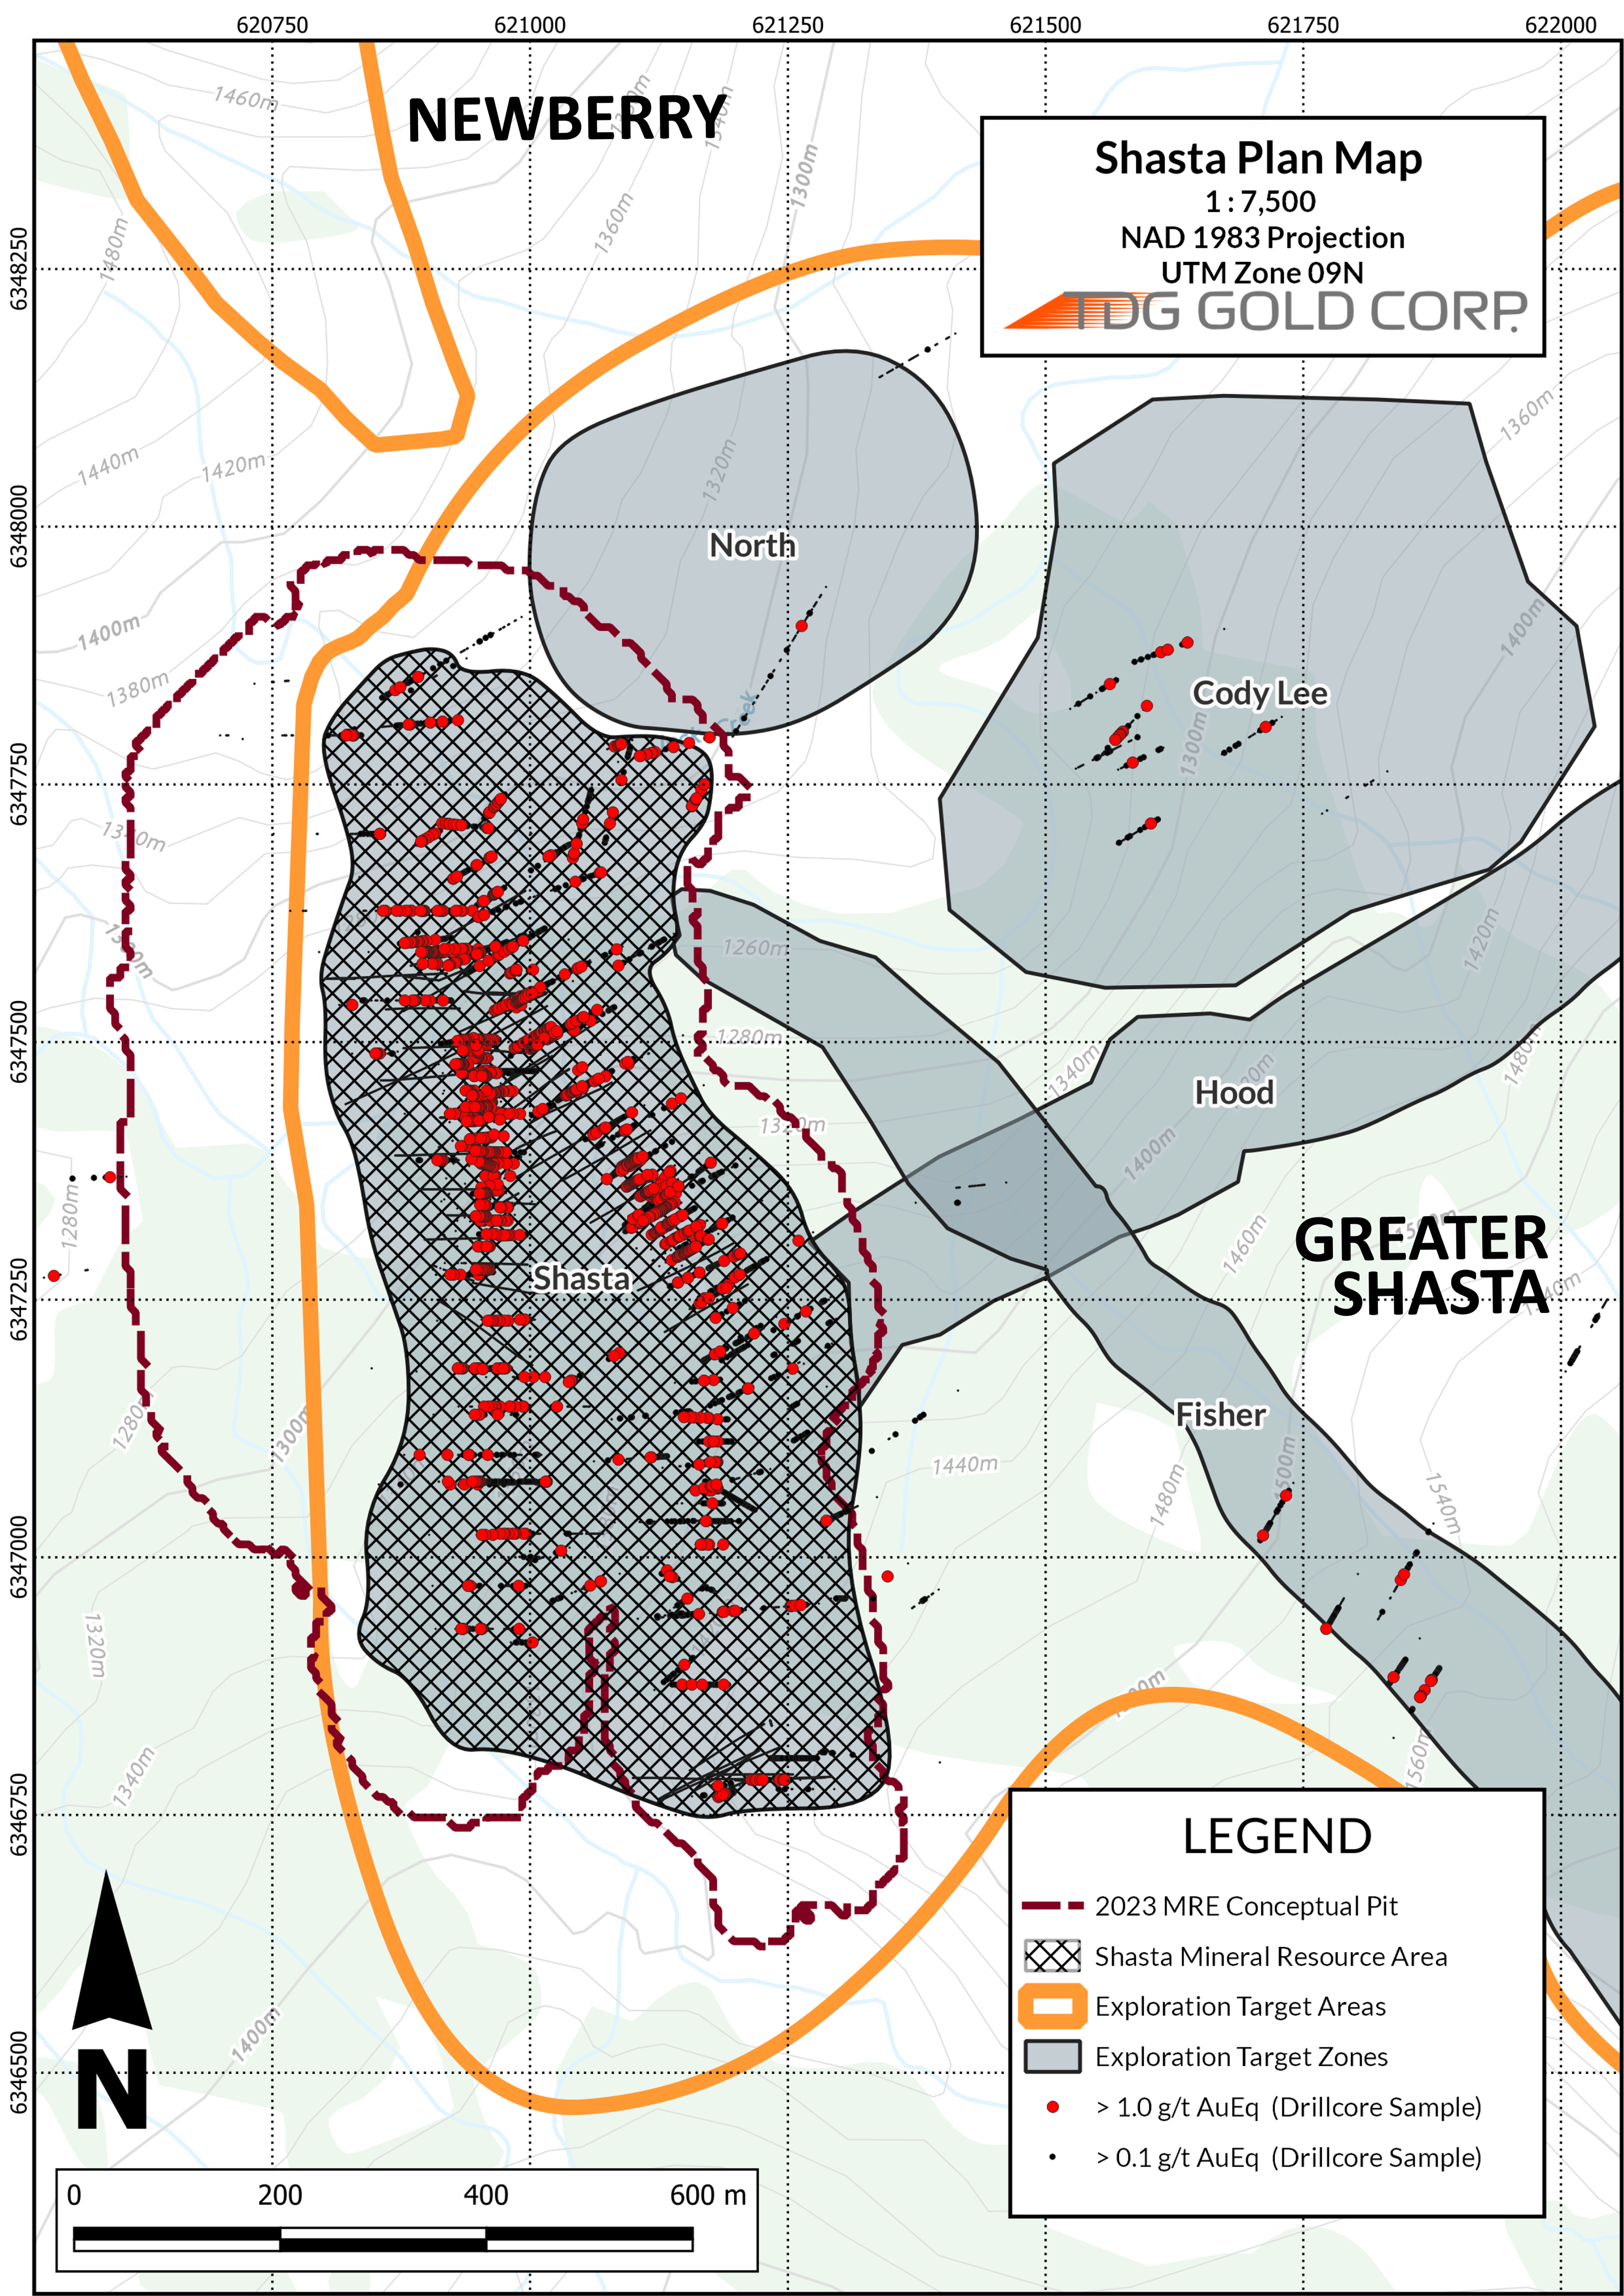
- MRE shows continuity and consistency, with an increased COG having relatively minor impact on the pit-constrained AuEq2 ounces.
- Shasta deposit remains open at depth and along strike (see TDG news release March 20, 2023).
- MRE does not include any of the Greater Shasta-Newberry3 satellite exploration target zones.
Fletcher Morgan, TDG's CEO, commented: "TDG has systematically expanded and upgraded the confidence in the Shasta deposit over the past two field seasons with ~13,250 metres of drilling. The Shasta deposit remains open along strike and at depth, with further potential for grade improvement and conversion of currently unclassified material contained within the mineral resource limiting pit to mineral resources through additional drilling.
In parallel, as we have previously disclosed, our technical team has outlined potential at Greater Shasta-Newberry for one or more additional Shasta scale deposits. Given the Shasta deposit's proximity to our existing infrastructure (consisting of the Baker mill, mine road, tailings storage facilities, mining leases and permits), we are keen to show that the project can continue to grow rapidly through targeting these satellite exploration target zones for drilling."
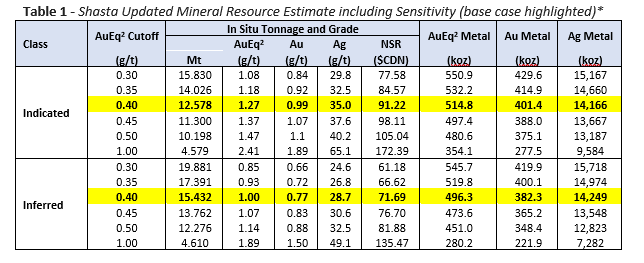
*Notes to the MRE table:
- The Mineral Resource estimate has been prepared by Sue Bird, P.Eng., an independent Qualified Person. The effective date of the mineral resource estimate is February 11, 2023.
- Mineral Resources are reported using the 2014 CIM Definition Standards and were estimated in accordance with the CIM 2019 Best Practices Guidelines, as required by NI43-101.
- Mineral Resources that are not Mineral Reserves do not have demonstrated economic viability. There is no certainty that all Mineral Resources will be converted into Mineral Reserves.
- These Mineral Resource estimates include Inferred Mineral Resources that are considered too speculative geologically to have economic considerations applied to them that would enable them to be categorized as Mineral Reserves. It is reasonably expected that the majority of Inferred Mineral Resources could be upgraded to Measured or Indicated Mineral Resource with continued exploration.
-
The Mineral Resource has been confined by a "reasonable prospects of eventual economic extraction" pit using the following assumptions, which were estimated from comparable projects:
- Au price of US$1,800/oz, Ag price of US$20/oz at an exchange rate of 0.75 US$ perCDN$;
- 99.8 % payable Au; 95.0 % payable Ag; US$4.25/oz Au and US$1.53/oz Ag offsite costs (refining, transport and insurance);
- a 1.5 % NSR royalty; and uses a 94.8 % metallurgical recovery for Au and 77.2 % recovery for Ag;
- Mining costs of CDN$2.56/tonne mineralized material, CDN$2.40/tonne waste, CDN$1.8/tonne overburden;
- Processing Costs of CDN$12/tonne and G&A of CDN$5.00/tonne processed;
- Pit slopes of 45 degrees.
- The resulting NSR equation is: NSR (CDN$) = 75.67*Au Grade*0.948 + 0.74*Ag Grade*0.772
- The resulting AuEq equation is: AuEq = Au + Ag*0.008
- The bulk density of the deposit is based on 2021 & 2022 measurements and is 2.61 throughout the deposit and 2.00 for overburden.
- The QP is not aware of political, environmental, or other risks that could materially affect the potential development of the Mineral Resources.
- Numbers may not sum due to rounding.
Overview
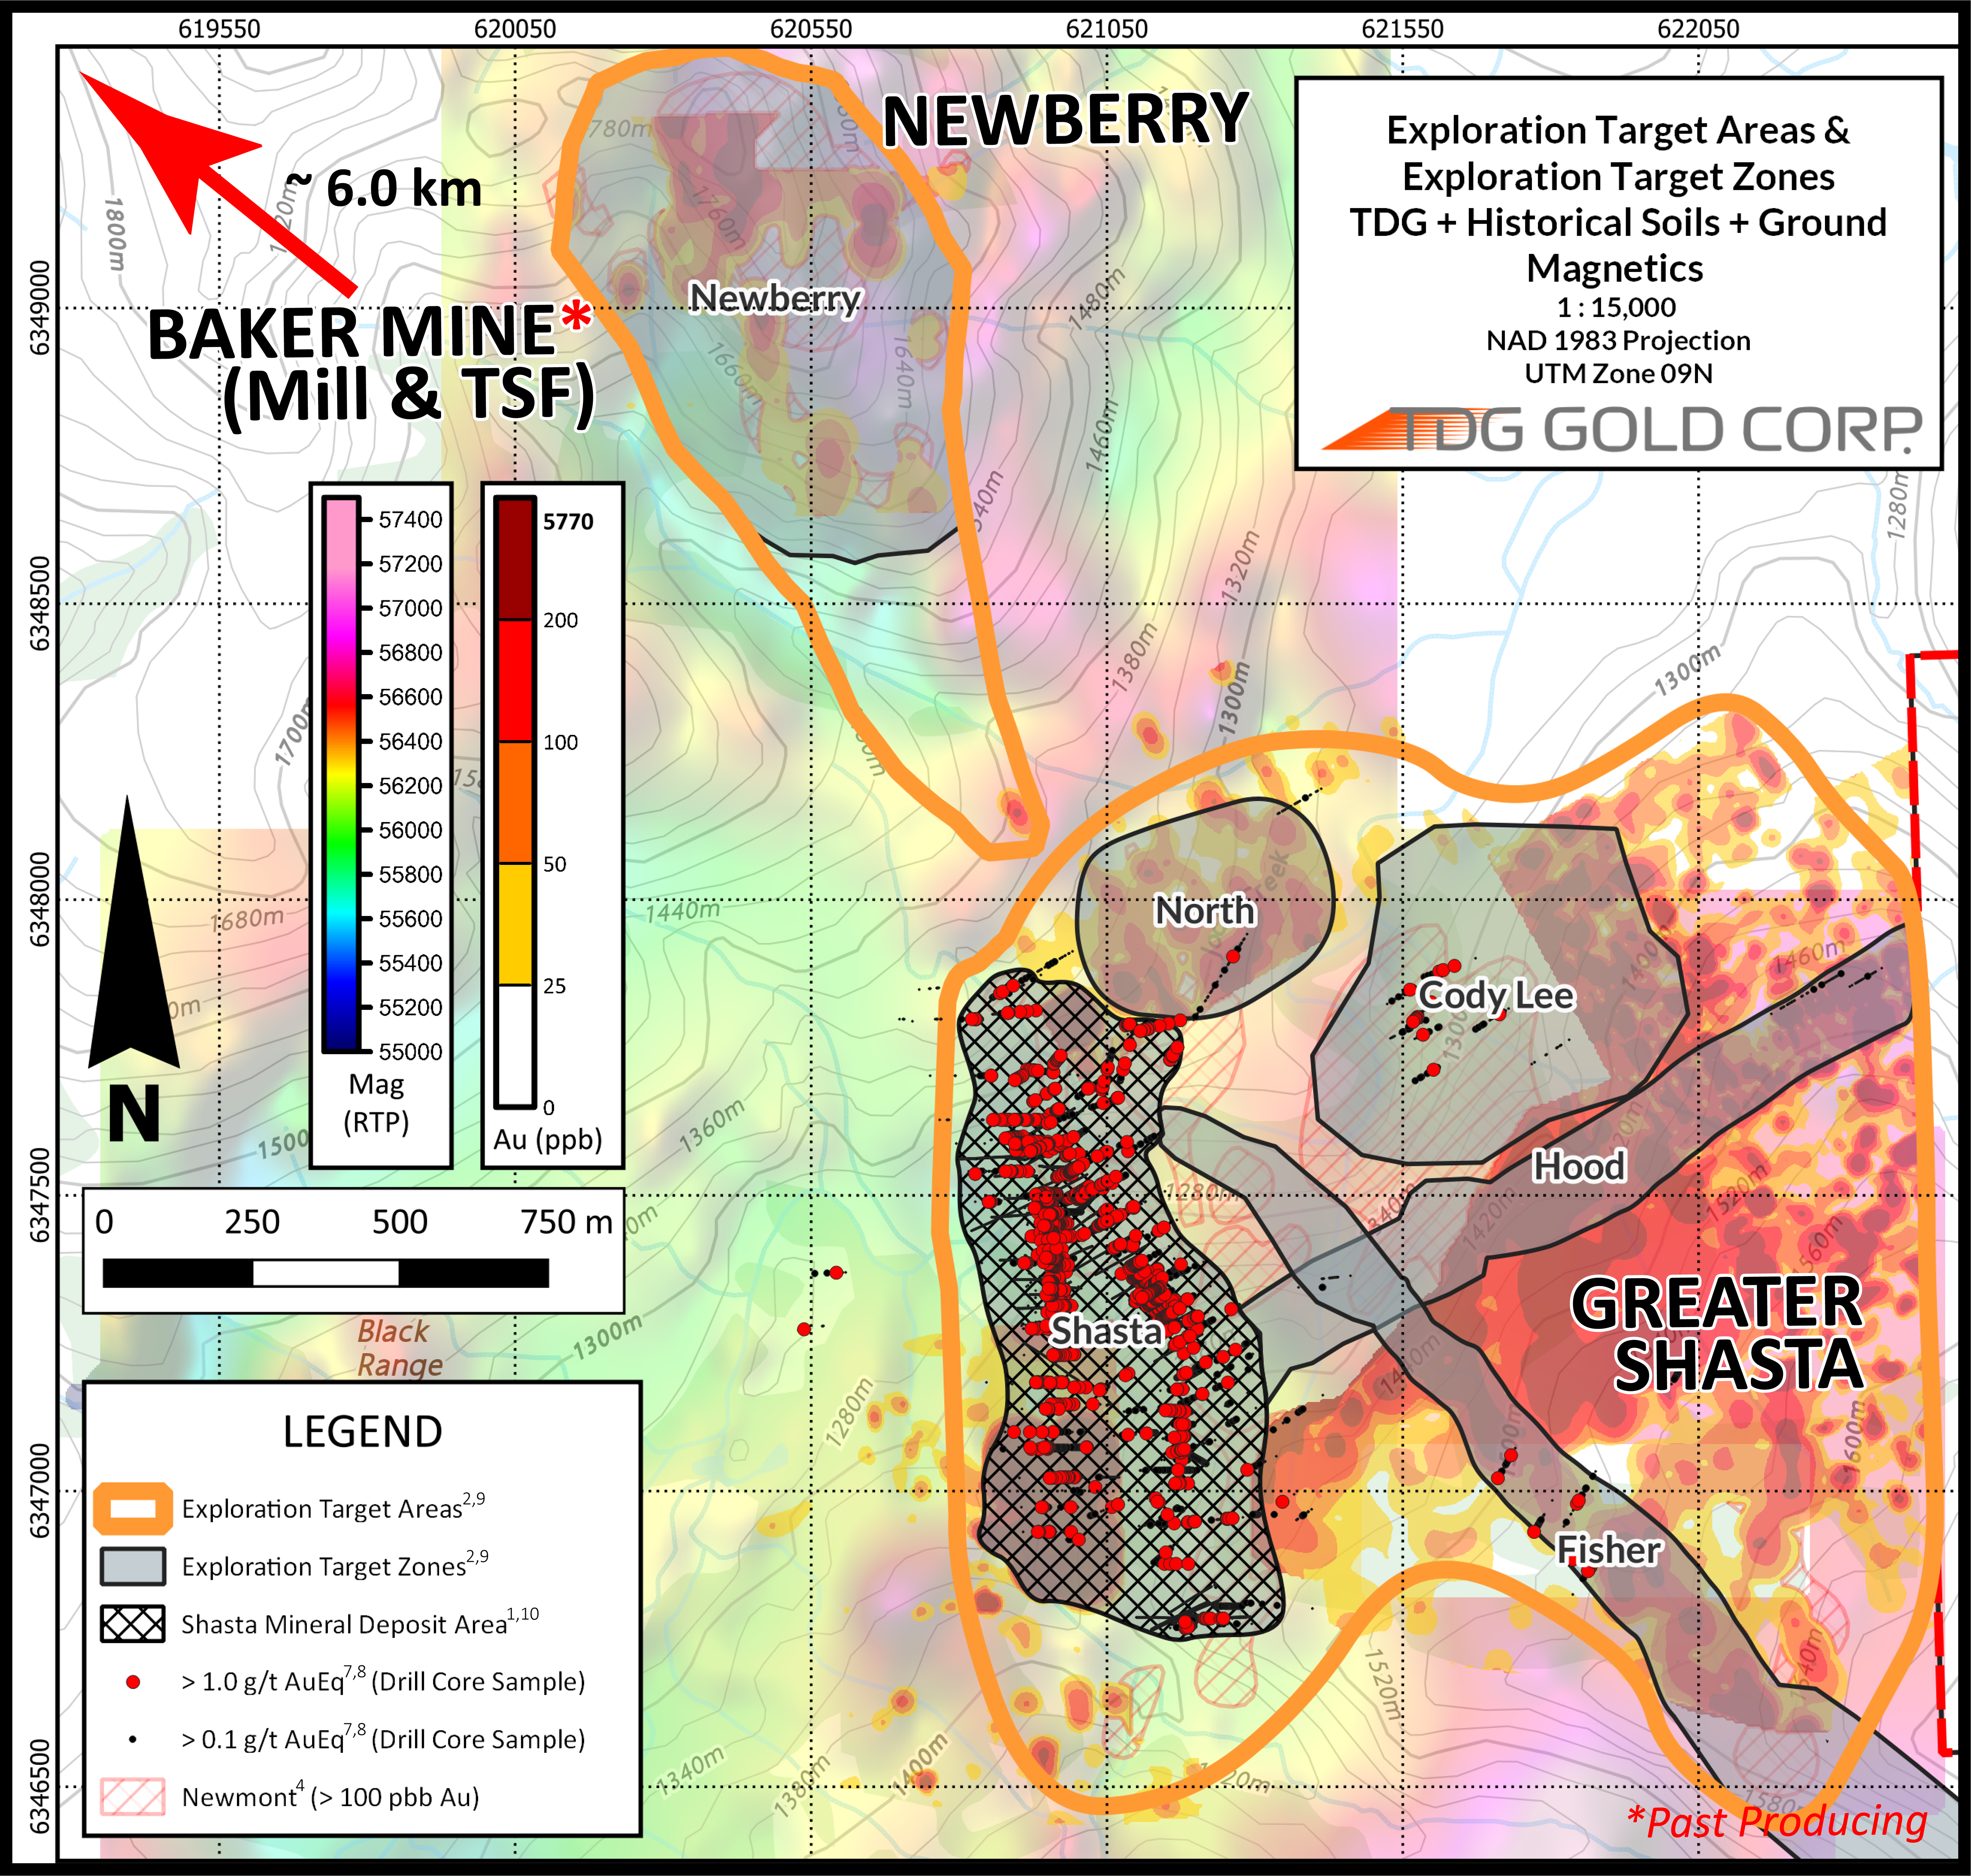
Following the release of the initial Shasta MRE1 in 2022 (see TDG news release May 17, 2022), TDG completed a second drill campaign of 5,034 m of HQ oriented diamond drilling in 21 drillholes. This Phase 2 program focused on infill drilling to upgrade the resource classification and additional drilling to step out and test for down dip/plunge extensions to the mineralized envelope. TDG also re-assayed all 2021 drill core with greater than detection concentrations of Au after a potential low bias was detected during data quality analysis (see TDG news release August 29, 2022). This work, in addition to re-modelling, has resulted in a MRE that has upgraded a significant portion of the mineral resource into the Indicated category and has added blocks outside of the original mineral resource model into the Inferred mineral resource. Exploration has also helped to identify target areas3 for potential future mineral resource expansion and reclassification in subsequent drilling (Figure 2).
Mineral Resource overview
The Shasta deposit mineral resource database consists of 384 drillholes with 18,526 assay intervals from 1983 through 2022. This represents 37,474 metres ("m") of assayed intervals at an average interval of 1.3 m per assay interval. Approximately 50 % of all assayed interval lengths of core used in the mineralized domains is comprised of TDG's modern, HQ diameter, oriented, diamond drill core from 2021 and 2022. The remaining assay intervals from the mineralized domains are from historical4,5 drilling. All data used for the mineral resource estimate has been validated statistically to show no significant bias, either by twinned drillholes in 2021 or through statistical comparison of historical4,5 data with TDG drilling using Point Validation. Historical drilling has also been validated by field validation of collar locations.
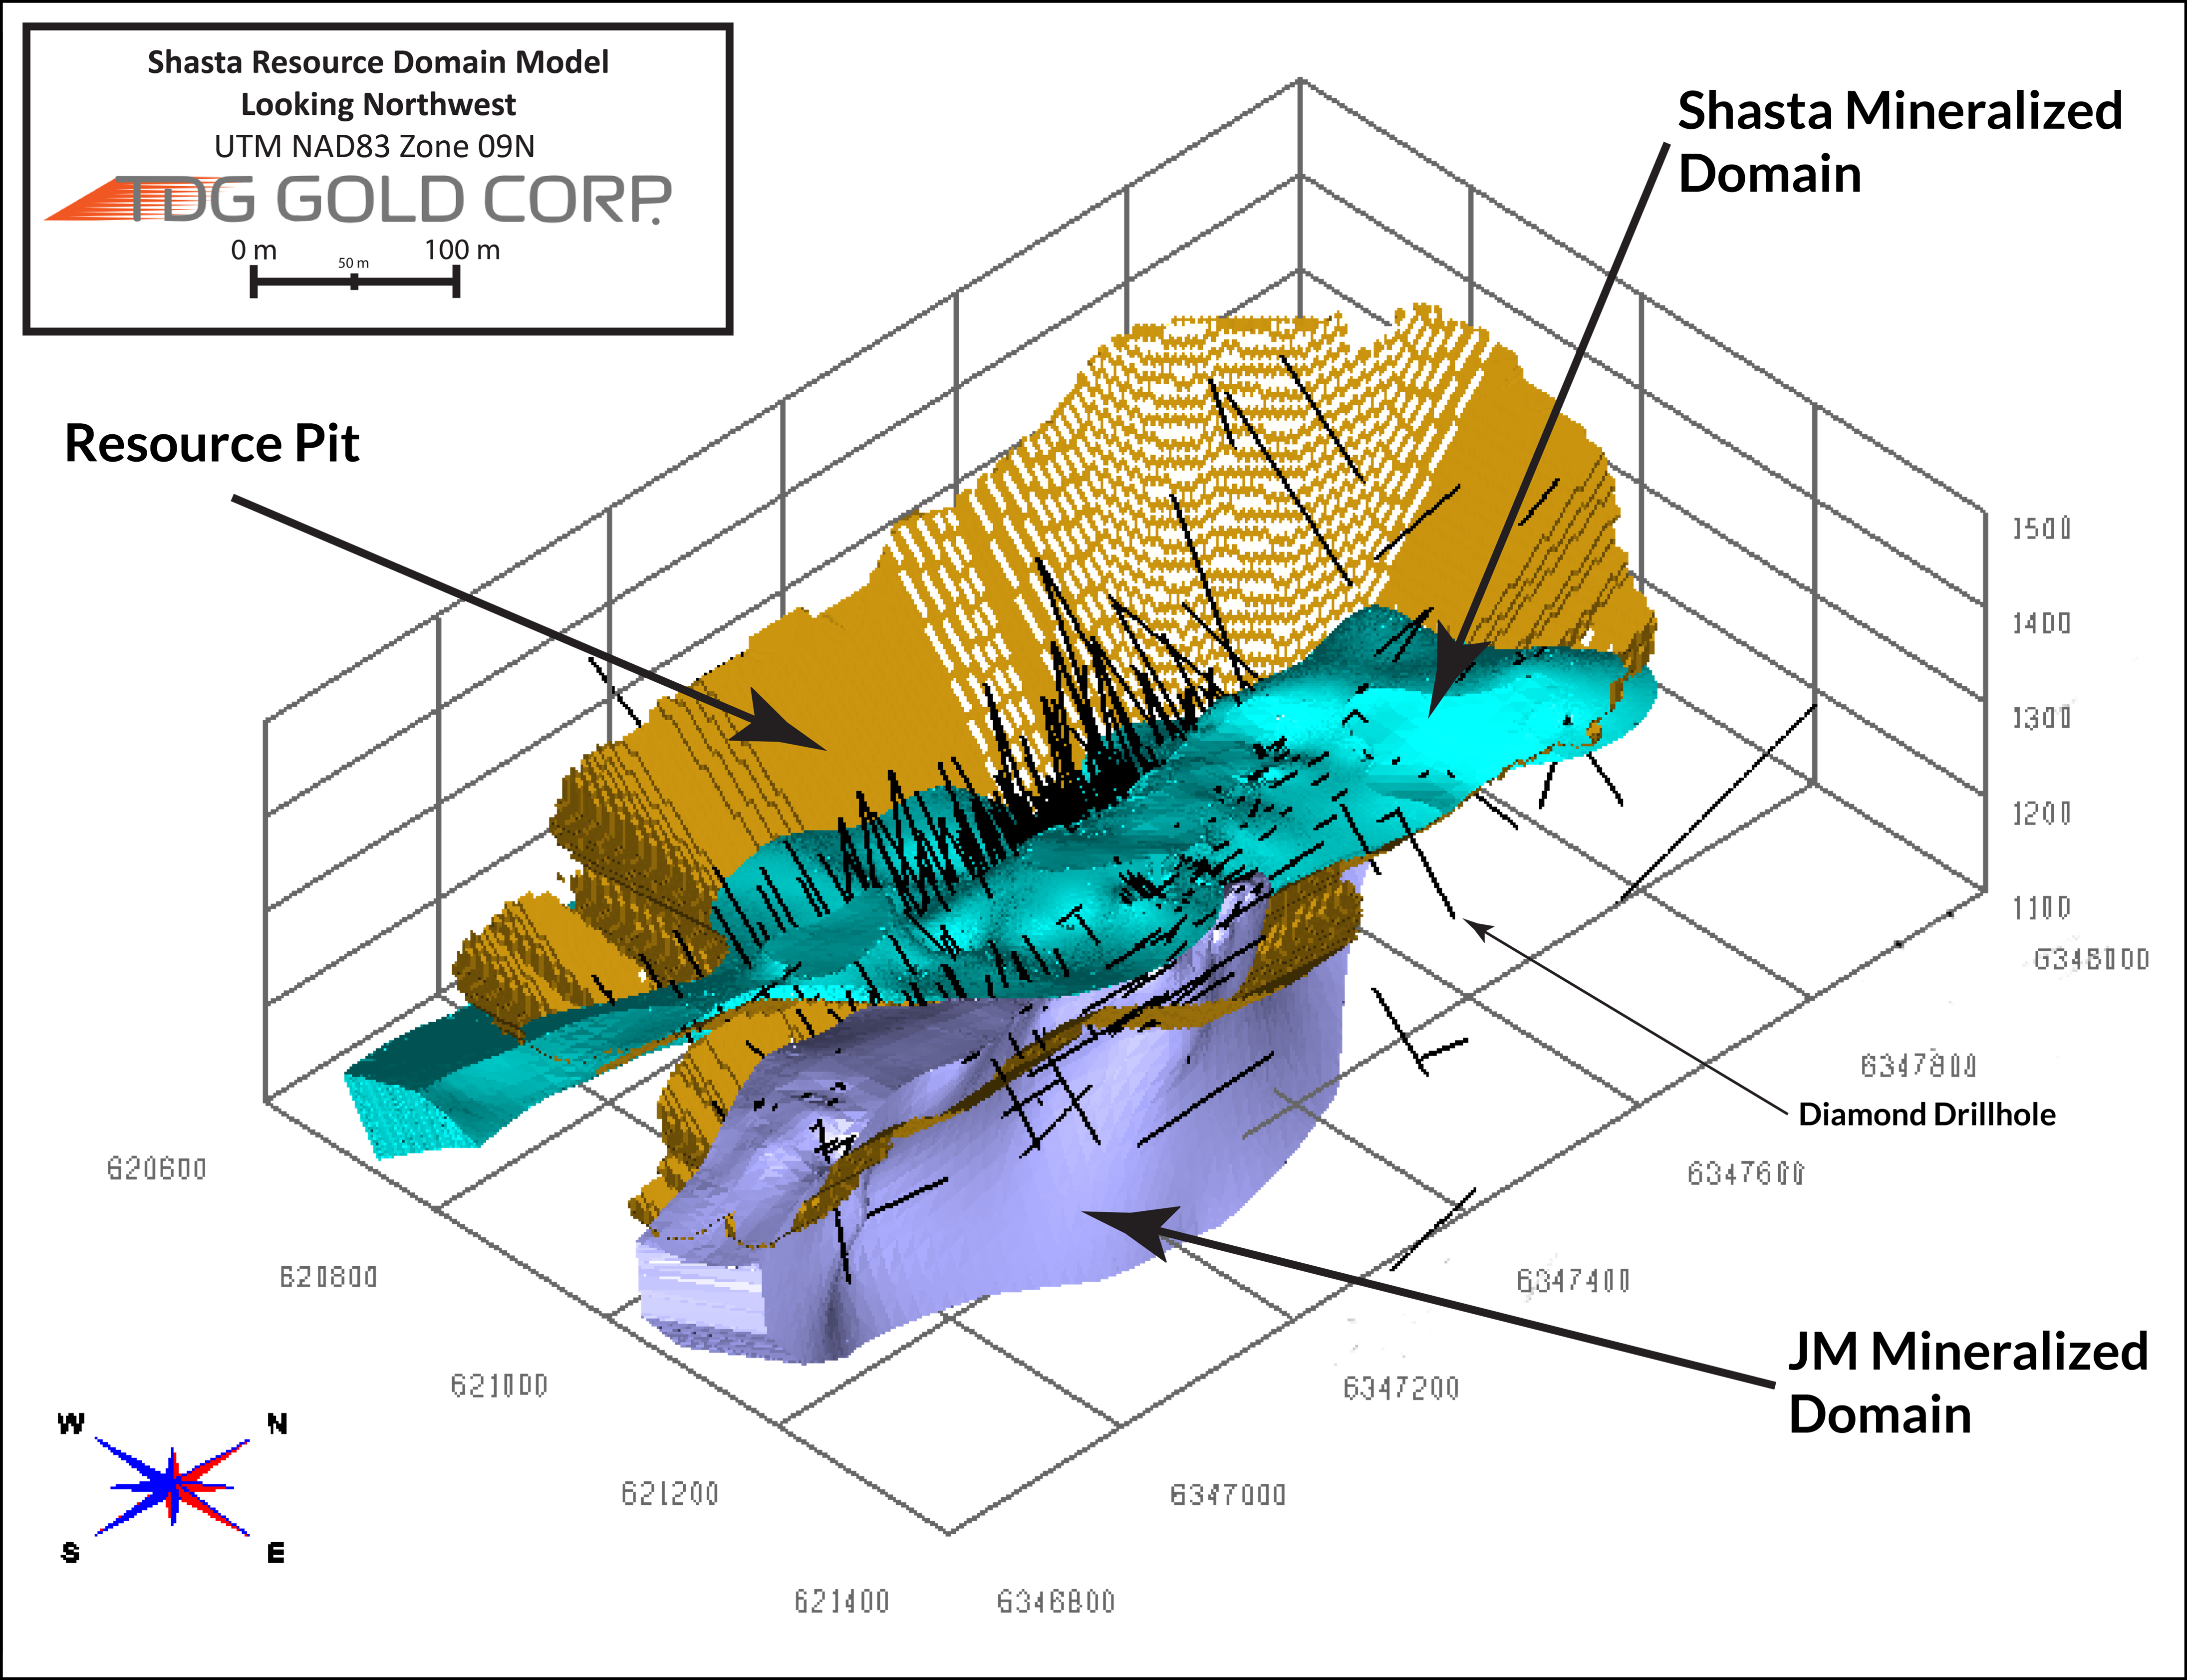
Two mineralized domains (Figure 3) were generated based on: (i) the major north-south Shasta fault system as well as, (ii) the northwest trending, sub-vertical JM zone. The block model (Figure 4) has a 5 m x 5 m x 5 m selective mining unit, with interpolation of Au and Ag calculated by Inverse Distance Cubed ("ID3"). The interpolations were limited by the domain boundaries and were clipped to the overburden surface. Historical mine workings4 were removed from the in-situ mineral resource estimate.
There are no other known factors or issues that materially affect the MRE other than normal risks faced by mining projects in the province of British Columbia, Canada, in terms of environmental, permitting, taxation, socio-economic, marketing, and political factors and additional risk factors as listed in the "Cautionary Note Regarding Forward-Looking Information" section below.
Mineral Resource growth potential
The Shasta mineral resource area (Figure 5, hatched area) is open at depth and along strike. This provides TDG with potential to increase the mineral resource outside of the current MRE pit extent in addition to potentially converting unclassified blocks that may be mineralized within the MRE pit between the two dominant mineralized trends (Shasta & JM). The expansion potential includes: (i) down-dip further west in the Creek/Shasta zone (see TDG news release February 21, 2023); (ii) east of the JM zone toward the Hood and Fisher zones3 (see TDG news release February 28, 2023); (iii) south of the JM pit where approximately 700 m of strike length is demonstrated to be mineralized but sparse drilling and poor assay density suggests potential to upgrade material within the MRE pit (see TDG news release February 7, 2022); (iv) further south beyond the Cayley-Rainer zone where soil geochemistry, historical4 trenching, outcrop mapping and ground geophysics suggest the anomalous trend continues; and, (v) north towards Newberry where the edge of the MRE pit is < 100 m from the edge of the Newberry exploration zone3 (see TDG news release February 28, 2023).
The Greater Shasta exploration target area3 (Figure 5) comprises ~256 hectares ("ha") of prospective exploration ground of which the Shasta mineral resource area accounts for only 43 ha. The other ~213 ha represents road-connected, highly prospective exploration ground with potential for the discovery of additional epithermal Au-Ag style mineralization in close proximity to the defined Shasta mineral resource area. During 2022, TDG focused grassroots exploration efforts on recompilation and targeting outside of the Shasta mineral resource area (Figure 1). This included a comprehensive data review led by key TDG consultant, Chris Dail, in addition to field exploration which included geological reconnaissance, ground geophysics and soil geochemistry (see TDG news release September 13, 2022). This work resulted in the defining of four high priority, drill-ready targets within the Greater Shasta target area3 (Figure 5) and the ‘rediscovery' of the Newberry target, the southern extent of which lies within 100 m of the Greater Shasta target area3 and is also drill-ready (Figure 5). These targets have similar geological, geochemical, geophysical and structural characteristics to the Shasta deposit (see TDG news releases April 03, 2023 and April 06, 2023) and present an opportunity to discovery and define additional mineralization in close proximity to the Shasta deposit.
Steven Kramar, TDG VP Exploration, commented: "Through our extensive data recompilation exercise, we have now defined multiple high priority target zones within the Greater Shasta-Newberry exploration target area of which the Shasta deposit is the first that we have drill tested. A pattern that is starting to emerge is the potential for these individual ‘higher priority' target zones to coalesce into what we hope will become a single, larger target. We have seen this with the Cody Lee zone, which has been expanded to the edge of the Hood zone. We have also seen this with the Fisher and Hood zones appearing to intersect east of the Shasta deposit and showing features that could suggest further connectivity into the Shasta deposit itself at the JM zone.
Within the 256 ha Greater Shasta area, all target zones lie within 1 kilometre of the Shasta MRE pit outline and almost the entirety of the Greater Shasta area is interconnected by historical exploration roads and trails. The potential to discover additional Shasta-sized deposits within the Greater Shasta-Newberry target area is a priority for our proposed future exploration programs."
Forward Plan
In order to continue to upgrade and expand the Shasta MRE, and in anticipation of progressing towards a preliminary economic assessment ("PEA"), TDG plans to:
- Integrate TDG's improved geological model using lithogeochemistry and detailed core logging from the 2021 and 2022 drill campaigns. The geology at Shasta is multifaceted, with alteration and hydrothermal brecciation often masking distinguishing features of primary lithology. TDG has employed modern lithogeochemical techniques to investigate: (i) if the volcanic/volcaniclastic facies of the Shasta deposit imply a distinct geochemical ‘fingerprint'; and, (ii) if there is a grade sensitivity based on lithogeochemical rheology. Improved understanding of controls on mineralization could further improve confidence in the MRE and provide tools for targeting additional mineralization.
- Reconfirm historical4 collar locations using Differential GPS ("DGPS"). A comprehensive program of high-precision DGPS to confirm/reconfirm as many historical4 collars in the Greater Shasta area3 as possible with a higher degree of precision than previously completed. This effort will modernize the Greater Shasta database (including the Shasta resource area) to a precision better than 50 cm; assisting with future exploration and vein location/orientation investigations. Such data are not expected to have a material impact on the current MRE but could improve understanding of controls on, and continuity of, mineralization.
- Undertake Detailed surveying of historical4 underground development. Utilizing DGPS, TDG will survey the historical4 portals to a precision better than 50 cm and access the underground workings to tie high precision modern DGPS coordinates with modern survey data. This will enable location of the historical4 underground workings to a certainty level of < 1 m and allow better control on future drilling from surface by providing a 3D view of the Shasta epithermal vein system and improve confidence in interpolation of mineralization.
- Complete the vein-orientation study and link this to the lithogeochemical/lithological analysis. TDG has two drill campaigns of high density oriented large (HQ) diameter core drilling around the Shasta deposit. Most of these cores are oriented and are undergoing vein orientation analysis which, combined with the lithogeochemical work, should assist in understanding the dominant orientations of veins/vein arrays that contain the highest precious metal concentrations. This could further improve confidence in the MRE and enhance vectoring of higher grade internal mineralized trends.
- Undertake additional drilling of the known open extensions of the mineralization. The Shasta deposit is open at depth and along strike (see TDG news release March 20, 2023). Drilling additional potential extensions of the known mineralized system could produce an increase in the overall Shasta mineral resource. Areas of interest have been identified within and adjacent to the proposed pit outline where drill density and assay data are currently sparse, but mineralization appears to persist; for example, between JM/Shasta zone and Cayley-Rainier zone(Figure 1). This area is within the mineral resource limiting pit and, as such, any mineralization encountered could positively impact a future MRE by increasing mineralized blocks and converting in-situ waste to mineralized tonnes, thus reducing the implied strip ratio.
- Exploring Greater Shasta-Newberry as a larger mineralized system. Exploration and drilling at Greater Shasta-Newberry offers the potential to increase understanding of the epithermal system and presents the opportunity to make one or more additional Shasta-sized discoveries for potential inclusion within a larger, updated MRE.
Geological Interpretation
The Shasta property is underlain predominantly by a succession of feldspar, quartz, biotite and hornblende crystal-rich pyroclastic and epiclastic rocks within the Toodoggone volcanics. In the Shasta deposit area, these rocks have been informally termed the basal series, the pyroclastic series and the epiclastic series based on differences in composition and depositional environments. In general, the epiclastic/volcaniclastic rocks occur to the west and north of the Shasta deposit whereas the pyroclastic rocks host the mineralization and underlie most of the area immediately south and east of the Shasta deposit. The structure on the Shasta property is dominated by north-northwest trending normal and/or dextral block faulting where tilting and rotation of the fault blocks is gentle, and the structural fabrics/breaks control the initial emplacement and/or displacement of the Au-Ag mineralization.
Geology of the Shasta deposit is a succession of rocks derived from volcanic activity and periods of quiescence with subsequent active weathering of volcanic slopes. Rocks hosting the Shasta deposit can be summarized as lapilli-ash tuffs, lapilli-block tuffs with minor ash-flows, lava flows and associated epiclastic rocks. Rocks within this succession can be cryptic to identify with alteration, mineralization and hydrothermal brecciation masking protolith identification. While compositional rheology within these units is likely associated with vein development, comprehensive investigations utilizing modern lithogeochemical techniques aided by high-density drilling has never been completed (see Forward Plan).
The Shasta deposit is a low sulphidation epithermal multiphase quartz-carbonate stockwork/ hydrothermal breccia vein deposit (quartz-adularia type) endowed by significant Au-Ag mineralization. The deposit consists of multiple overlapping high-grade quartz-calcite stockwork/breccia systems that display similar characteristics, occurring as narrow curviplanar breccias that pinch and swell with variable alteration and vein intensity over known strike lengths > 1,000 m, in addition to a lower grade ‘halo' of mineralized rocks hosting Au-Ag mineralization proximal to the high-grade breccias.
Mineralization is dominantly native gold, silver, electrum and acanthite associated with finely disseminated grey sulphides and coarser grained pyrite. Mineralization is associated within quartz and calcite, with higher grades associated with higher proportions of calcite/quartz ratios. While rocks from the Shasta deposit can be strongly altered and/or silica flooded, alteration (potassic, chloritic, phyllic and propylitic) visual wallrock alteration intensity does not appear to be indicative of precious metal concentrations and geochemical methods are better utilized. Au:Ag ratios range from 1:10 (i.e. 1 g/t Au per 10 g/t Ag) to 1:100 with a deposit average of about 1:45.
The Au-Ag mineralization of the Shasta deposit is structurally controlled along two dominant trends, the Shasta/Creek zone and the JM zone. The two trends encompass most of the historically4 mined mineral resources during past mining efforts. The Creek/Shasta zone strikes approximately 180°, dips moderately to the west, and has a strike extent of at least 800 m. The JM zone strikes approximately 330°, dips steeply to the east, and has a strike extent of at least 1,000 m. Both zones have an interpreted shallow northern plunge, with the attitude of the structures producing an inverted "V" shape geometry converging in the north and diverging to the south.
The Au-Ag mineralization crosses lithological boundaries. The Shasta/Creek zone mineralization may be associated with the Shasta fault, and the high-grade ‘core' of the mineralized envelope approximates the attitude of the Shasta fault for a significant portion of the strike length. While the Shasta fault is likely post-mineral, the north-northwest trend of the Shasta fault (and regional structures) and associated lithological units are continuous along the western portion of the Shasta deposit, and therefore modelling economic grade along these trends (i.e. lithological and mineralization) is appropriate to use as the primary basis of the 3D modelling. The JM zone has been interpreted as a fracture system with internal hydrothermal brecciation and has a consistently mapped attitude and trend of the high-grade mineralization (core) across significant distance of strike length. The improved lithological model demonstrates continuity across a significant portion of strike length, and thus the same methodology is applied to modelling as the Shasta/Creek zone. Geological downhole structural data (faults) were utilized to assist in the generation of the 3D Shasta domain model.
Data Verification
TDG followed industry standard Quality Assurance/Quality Control ("QA/QC") protocols for the 2021 and 2022 drill programs by inserting blind certified reference materials ("CRMs"), field duplicates and blanks into the sample stream of core samples at sufficient proportions to primary core samples. QA/QC is maintained internally at the lab through rigorous use of internal CRMs, blanks, and duplicates.
If a QA/QC sample returns an unacceptable value an investigation into the results is triggered and, when deemed necessary, the samples that were tested in the batch with the failed QA/QC sample are re-tested.
The drill cores from 2021 and 2022 drilling were delivered to the core shack at TDG's Baker Mine site, and processed by geologists who inserted QA/QC samples into the sampling sequence. The drill core was cut in half (1/2 HQ core) and placed in zip-tied polyurethane bags, then in security-sealed rice bags before being delivered directly from the Baker Mine site to Bandstra Transportation Systems in Prince George, B.C., enroute to either:
- SGS' laboratory in Burnaby, B.C., for preparation and analysis of 2021 drillcore samples. Samples were prepared and analyzed following procedures summarized in Table 2, where information about methodology can be found on the SGS Canada Website, in the analytical guide (here).
- ALS' preparation facility in Kamloops, B.C., and ultimately to the ALS' laboratory in North Vancouver, B.C., for 2021 drillcore samples. Samples were prepared and analyzed following procedures summarized in Table 2, where information about methodology can be found on the ALS Global website, in the analytical guide (here).
Table 2 - 2021 & 2022 Assay Methodology
Year |
Lab |
Method (Au) |
Method (Ag) |
Method (Overlimit - Au) |
Method (Overlimit - Ag) |
2021 |
SGS |
GO_FAI50V10 |
GE_IMS40Q12 |
N/A |
GO_ICP42Q100/GO_FAG37V |
2022 |
ALS |
AU-ICP22 |
MEMS61 |
Au-GRA22 |
Ag-GRA22 |
Historical4,5 data were verified using Point Validation, by interpolating the Au and Ag grades to locations of the historical4,5 data for comparison. In addition, two of the 2021 drillholes were twins of historical4,5 drilling. Based on these analyses, the historical4,5 drilling for years 1983 to 2006 show no significant bias.
Drill collar validation was completed using handheld (GARMIN GPSMAP64 or equivalent) GPS equipment, selecting a subset of historical4,5 collars to validate positions inherited from the historical4,5 database. In 2022, a DGPS was utilized to further validate historical4,5 collars and rectify locations into modern UTM NAD83 Zone: 9 north coordinate system (from a locally derived mine grid). Collar locations from the 1980/90s era drilling were validated for use in the mineral resource database, whereas drillholes from 2007 & 2010 drill were not able to be validated and were excluded from the mineral resource estimate. It is anticipated that with further effort these excluded drillholes may be recovered after their collars have been located more precisely (see: Forward Plan).
Key Assumptions and Methods Used for the Mineral Resource Estimate
Grade Capping
Cumulative probability plots ("CPPs") for the assays within both domains have been used to determine high grade outliers which were capped (Table 3). CPPs of the composited data (composited at 2 m) have been used to determine the Outlier Restriction during interpolation. Outlier restriction values are applied for distances beyond 5 m from the composite locations.
Table 3 - Capping and Outlier Restriction Values
Assay Capping Values |
Composite Outliers |
|||||||
DOM |
Au |
# capped |
Ag |
# capped |
Au |
# of outliers |
Ag |
# of outliers |
(g/t) |
(g/t) |
(g/t) |
(g/t) |
|||||
1 |
100 |
1 |
2000 |
8 |
50 |
2 |
1000 |
10 |
2 |
50 |
1 |
3000 |
1 |
50 |
n/a |
1000 |
2 |
Variography and Interpolations
Variography was completed on each domain for Au and Ag to determine appropriate search parameters. Interpolation has been done by ID3 in 4 passes with increasing search distances up to 150 m for the major and minor axes. The modelled grades have been validated using de-clustered composites (Nearest Neighbour or Polygonal model) and indicate no global bias with appropriate smoothing throughout the grade-tonnage curves.
Classification of Mineral Resource Criteria
Volumes of the mineral resource that contained 2021 and/or 2022 drilling data with an average distance between two drillholes of 50 m (or less), were considered Indicated. The mineral resource was assigned to Inferred for all other blocks interpolated, with a Au grade.
Cut-off Grade
The COG was selected using AuEq2 to cover, as a minimum, the processing and G&A costs and to account for the metallurgical recovery, smelter terms and royalties. In 2022, the base case COG was 0.3 g/t AuEq2 which approximates the marginal economic COG; and in the current, 2023 resource estimate the base case COG is assigned at 0.4 g/t AuEq2, a 29 % increase in COG, improving the quality of the MRE.
Preliminary Metallurgical Analysis
TDG performed preliminary metallurgical analysis (see TDG news release May 02, 2022) for select cores drilled in 2021. Direct cyanidation achieved extraction percentages of 84.7 % to 96.4 % for Au, and 69.1 % to 80.5 % for Ag; flotation testing delivered recoveries to concentrate of 94.3 % and 98.0 % for Au, and 88.4 % and 96.0 % for Ag; and flotation concentrate regrinding and cyanidation delivered recoveries of 87.7 % to 94.8 % for Au, and 64.8 % to 77.2 % for Ag. The metallurgical results are in line with the historical4 mill records at the time when ore from Shasta was last processed at the Baker mill (2012) and these results were utilized in the MRE calculation to help guide potential metal recovery scenarios.
Qualified Persons
The geologically related technical content of this new release has been reviewed and approved by Steven Kramar, P.Geo., Vice President, Exploration for TDG and a Qualified Person, as defined under National Instrument 43-101.
The technical information relating to the mineral resource estimate has been prepared by Sue Bird, P.Eng. (Moose Mountain Technical Services) a Qualified Person, as defined under National Instrument 43-101 and who is independent of TDG.
1Mineral Resource Estimate (MRE): All scientific and technical information relating to the TDG's Shasta Project pertaining to the Initial Mineral Resource Estimate ("Initial Shasta MRE") contained in this news release is derived from the Technical Report dated June 30, 2022 (with an effective date of May 16, 2022) titled "NI 43-101 Resource Estimate for the Shasta Deposit" (the "2022 Technical Report") prepared by Sue Bird, MSc., P.Eng. of Moose Mountain Technical Services. The information contained herein in respect of the Initial Shasta MRE is subject to all of the assumptions, qualifications and procedures set out in the 2022 Technical Report and reference should be made to the full text of the 2022 Technical Report, a copy of which has been filed with the securities regulators in each of the provinces of Canada (except Québec) and is available on www.sedar.com.
2Gold Equivalent (AuEq): Gold Equivalent (AuEq) is used for illustrative purposes, to express the combined value of Au and Ag as a percentage of Au on an in-situ basis. Calculations are uncut and recovery is assumed to be 94.8% for Au and 77.2% for Ag, with an Au price of US$1,800/oz and an Ag price of US$20/oz (based on price of gold trends over the past approximately three years), giving a resulting AuEq equation: AuEq = Au + Ag*0.008. Actual prices and recoveries (following metallurgical test work) may differ from these assumptions, which would change the ratio.
3Mineral Exploration/Exploration Target Area(s): TDG is a mineral exploration focused company and the Company's Projects are in the mineral exploration stage only. The degree of risk increases substantially where an issuer's properties are in the mineral exploration stage as opposed to the development or operational stage. Exploration Targets and/or Exploration zones are speculative and there is no certainty that any future work or evaluation will lead to the definition of a mineral resource.
4Historical Data: This news release includes historical information that has been reviewed by TDG's qualified person ("QP") and the independent resource QP. The historical drillholes assay values and collar locations that were used in the MRE have been validated by the independent resource QP. Review of the historical records and information reasonably substantiate the validity of the information presented in this news release. However, TDG cannot directly verify the protocols utilized in the collecting of the historical data, including (but not limited to) the procedures used for sample collection and analysis. TDG encourages readers to exercise appropriate caution when evaluating these data and/or results.
5Historical Drill core Sampling & Assay Methodology: Historical core was geologically logged with lithologies identified and notable geological features recorded. Historical core was cut in half (and in rare cases sawn in half) along sample intervals (lithology and mineralization dependant) generally less than 3 m. Chemical analysis was performed dominantly for precious metal analysis (Au and Ag), and infrequently for base metals (Pb, Zn and Cu), and rarely for major elements and trace elements. Historically, different commercial laboratories were utilized in addition to an assay lab at Baker Mine site. These lab facilities may or may not have had accreditation and in all cases accreditation (if applicable) pre-dated current ISO standards. Over that period, a variety of digestion and assay methods were used, including atomic absorption, fire assay atomic absorption, aqua regia atomic absorption and aqua regia ICP with varying detection limits. Reference materials (if any) were inserted at the analytical level and thus were unblind to the facility processing the samples.
About TDG Gold Corp.
TDG is a major mineral and placer tenure holder in the historical Toodoggone Production Corridor of north-central British Columbia, Canada, with over 23,000 hectares of brownfield and greenfield exploration opportunities under direct ownership or earn-in agreement. TDG's flagship projects are the former producing, high-grade gold-silver Shasta, Mets and Baker mines, which are all road accessible, produced intermittently between 1981-2012, and have over 65,000 m of historical4,5 drilling. The projects have been advanced through compilation of historical4 data, new geological mapping, geochemical and geophysical surveys and, at Shasta 13,250 m of modern HQ drill testing of the known mineralization occurrences and their potential extensions. In May 2022, an initial Mineral Resource Estimate was published for Shasta (see TDG news release May 17, 2022) and which has been updated in this current news release. In January 2023, TDG defined a larger exploration target area adjacent to Shasta (Greater Shasta-Newberry; see TDG news release January 25, 2023) with drill-ready targets where TDG aims to undertake follow-up exploration activities in 2023.
ON BEHALF OF THE BOARD
Fletcher Morgan
Chief Executive Officer
For further information contact:
TDG Gold Corp.,
Telephone: +1.604.536.2711
Email: info@tdggold.com
Neither TSX Venture Exchange nor its Regulation Services Provider (as that term is defined in the policies of the TSX Venture Exchange) accepts responsibility for the adequacy or accuracy of this release.
Forward Looking Statements
This news release contains forward-looking statements that are based on the Company's current expectations and estimates. Forward-looking statements are frequently characterized by words such as "expand", "demonstrate", "hope", "continue" "potential", "prospective", "discover", "priority", "drill-ready", "opportunity", "anticipate", "progress", "expected", "impact", "intersect", "connectivity", "discover", and variations of these words as well as other similar words or statements that certain events or conditions "could", "may", "would" or "will" occur. Such forward-looking statements involve known and unknown risks, uncertainties and other factors that could cause actual events or results to differ materially from estimated or anticipated events or results implied or expressed in such forward-looking statements. Such factors include, among others: the actual results of current and planned exploration activities; the potential to expand the Shasta MRE beyond its current limits and to convert unclassified material within the MRE-limiting pit to mineral resources; the interpretation of the Fisher and Hood Zones as representing a potential mineralized trend, and the potential for extensions to the Fisher and Hood Zones; the interpretation that the Greater Shasta-Newberry Target Area represents a larger mineralized system encompassing several target zones and the potential that such zones may represent additional Shasta-like deposits; the results of planned geophysical and geochemical studies planned for 2023; the results of re-logging and resampling of historical4,5 core; the ability to further improve confidence in the Shasta MRE and the potential for, and timing of, a larger, updated MRE; conclusions of future economic evaluations; changes in project parameters as plans to continue to be refined; possible variations in grades of mineralization and/or future actual recovery rates; accidents, labour disputes and other risks of the mining industry; the availability of sufficient funding on terms acceptable to the company to complete the planned work programs; delays in obtaining governmental approvals or financing; and fluctuations in metal prices. There may be other factors that cause actions, events or results not to be as anticipated, estimated or intended. Any forward-looking statement speaks only as of the date on which it is made and, except as may be required by applicable securities laws, the Company disclaims any intent or obligation to update any forward-looking statement, whether as a result of new information, future events or results or otherwise. Forward-looking statements are not guarantees of future performance and accordingly undue reliance should not be put on such statements due to the inherent uncertainty therein.
SOURCE: TDG Gold Corp.
View source version on accesswire.com:
https://www.accesswire.com/752133/TDG-Gold-Corp-Increases-Grade-Quantity-and-Confidence-in-Mineral-Resource-Estimate-for-Shasta-Toodoggone


